Page speed describes how quickly a webpage loads, displays its important content and becomes responsive enough for someone to use comfortably.
It is part of the wider website performance picture and closely related to Core Web Vitals, which measure real-world loading performance, responsiveness and visual stability.
Page speed matters for two reasons.
First, performance contributes to the overall experience Google considers when evaluating webpages.
Second, and often more importantly, slow pages frustrate real visitors. Someone trying to book an appointment, request a quote or find a phone number may leave before the page becomes useful.
The goal is not simply to make a testing tool turn green.
It is to make the website fast for the people actually using it.
Page speed vs Core Web Vitals
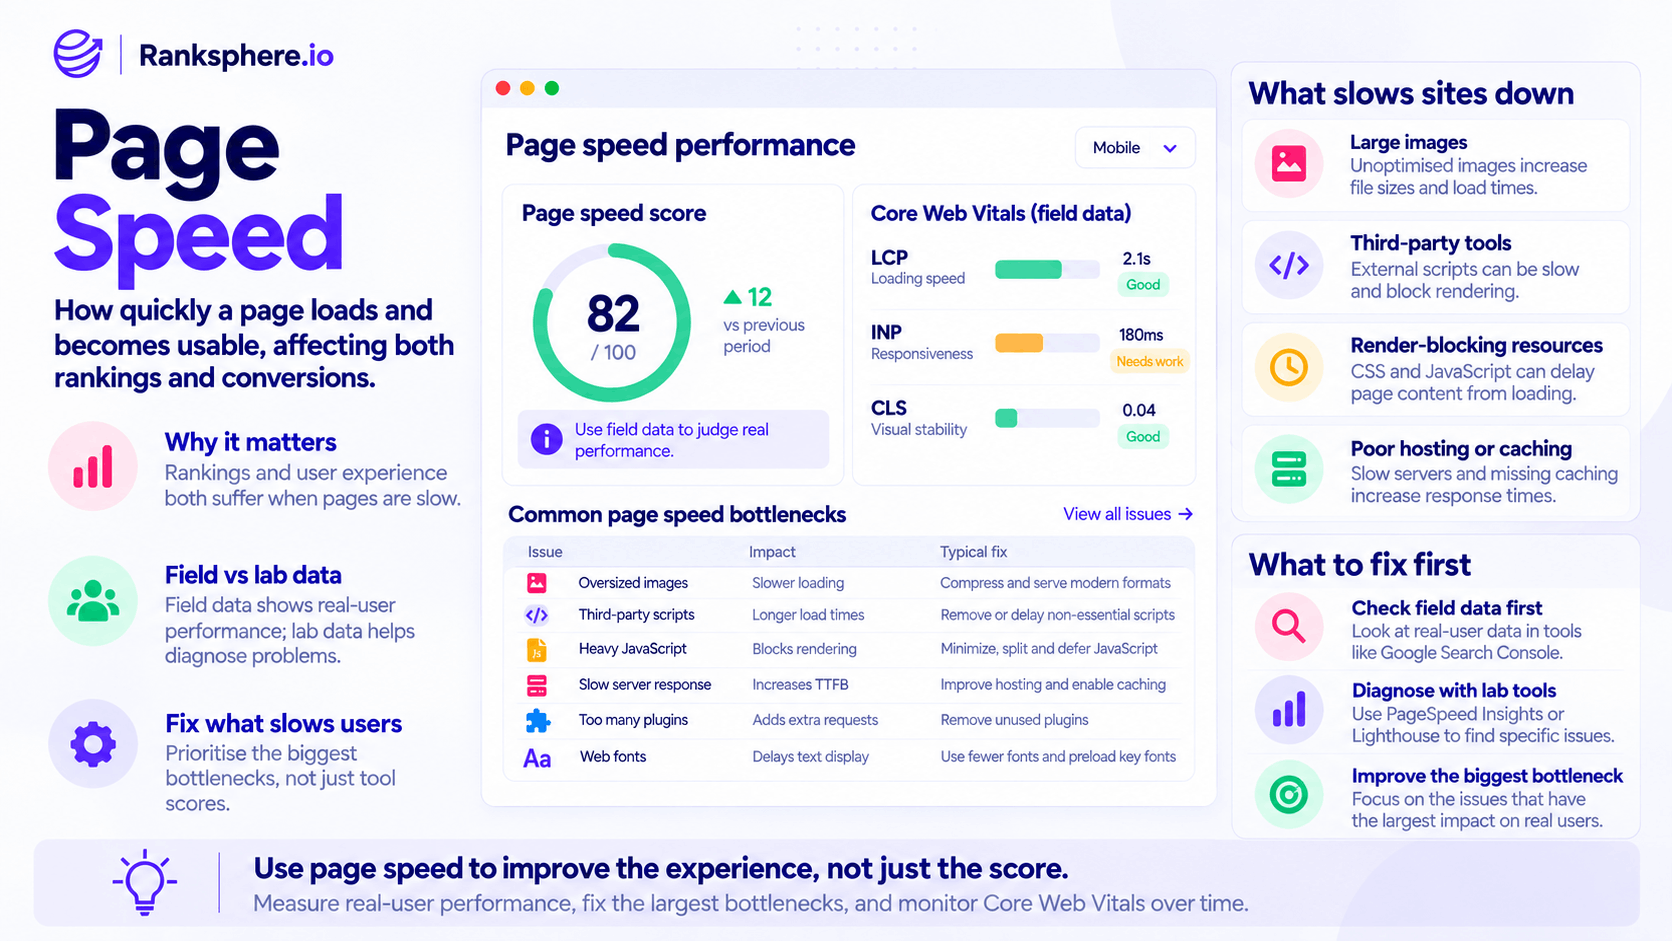
Page speed and Core Web Vitals are related, but they are not exactly the same thing.
Page speed is the broader subject of how quickly a webpage loads and responds.
Core Web Vitals are specific user-experience metrics used to measure important parts of that performance.
They currently cover:
- Largest Contentful Paint (LCP) — loading performance
- Interaction to Next Paint (INP) — responsiveness
- Cumulative Layout Shift (CLS) — visual stability
A website can therefore have a general speed problem that affects one or more Core Web Vitals, but page performance also includes areas such as:
- Server response time
- Image delivery
- JavaScript execution
- CSS loading
- Fonts
- Caching
- Third-party resources
Think of Core Web Vitals as important measurements within the wider topic of page speed.
Why page speed matters for SEO
A fast website does not automatically rank well.
Search engines still need the page to be relevant, useful, crawlable and indexable.
But performance is part of the overall page experience, and there is little benefit in earning visibility if visitors reach the page and immediately struggle to use it.
For example, a local service page may contain excellent information but still lose potential customers if:
- The hero image takes several seconds to appear
- The menu does not respond when tapped
- The enquiry form freezes
- Content jumps while the page loads
- A booking widget delays the rest of the page
So page speed should be treated as both an SEO consideration and a user-experience issue.
Lab data vs field data
One of the most common sources of confusion around page speed is the difference between lab data and field data.
They answer different questions.
Lab data
Lab data comes from a controlled or simulated test.
Tools such as Lighthouse can load a webpage under predefined conditions and measure what happens.
Lab testing is useful because it is:
- Repeatable
- Fast
- Good for debugging
- Useful before and after development changes
It can help identify specific problems such as:
- Oversized images
- Long JavaScript tasks
- Render-blocking resources
- Unused code
- Poor caching
But it is still a simulation.
Field data
Field data comes from real visitors using real devices and network connections.
Google's Chrome User Experience Report, often shortened to CrUX, provides this type of real-world performance data for eligible pages and origins.
Field data reflects the conditions your visitors actually experience.
That can include:
- Older phones
- Slow mobile connections
- Different screen sizes
- Different geographic locations
- Cold browser caches
- Varying device performance
A site that feels instant on a developer's laptop can perform very differently for a customer on a mid-range phone using mobile data.
Lighthouse vs PageSpeed Insights
Lighthouse and PageSpeed Insights are closely related but should not be treated as interchangeable with real-user performance.
Lighthouse
Lighthouse runs a lab test.
It produces a performance score and diagnostic recommendations based on a simulated environment.
That score can be useful for identifying problems.
It is not itself the goal.
PageSpeed Insights
PageSpeed Insights can combine two types of information:
- Real-user field data where available
- Lighthouse lab diagnostics
That makes it useful because you can see both:
What real users are experiencing
and:
What technical problems may be causing it
A useful workflow is:
Field data identifies the problem → lab data helps diagnose it → development fixes it → field data confirms whether users improved.
Why a high Lighthouse score is not enough
A strong Lighthouse score can be encouraging.
It does not prove that every visitor receives the same experience.
For example, Lighthouse may test the page under one simulated device and connection profile.
Real customers may be using:
- Lower-powered phones
- Busy mobile networks
- Different browsers
- Devices running other apps
- Slower regional connections
So do not optimise solely for:
“Get the score from 91 to 100.”
A change that improves a real user's experience is more valuable than one that simply adds a few points to a lab score.
The 75th percentile
Core Web Vitals field performance is commonly evaluated at the 75th percentile.
This means the focus is not simply on the average visitor or the fastest experience.
A page should perform well for the large majority of real users.
This helps explain why website owners sometimes say:
“The site is fast for me.”
while field data shows a problem.
Their personal experience is one data point.
Real-user reporting covers a much broader range of devices and conditions.
The 28-day field-data window
CrUX field data is based on a rolling 28-day period.
That means performance reports do not update immediately when you make a change.
Suppose you optimise a large image today.
A lab test may show the improvement immediately.
Field data changes more gradually as newer visits replace older measurements within the reporting window.
This is why page-speed work often requires two types of validation:
Immediate validation through lab testing.
Longer-term validation through real-user field data.
Do not assume a fix failed simply because field metrics have not changed after a few days.
What slows a website down?
The same performance problems appear repeatedly across small-business websites.
Oversized images
Images are one of the most common causes of slow pages.
A business may upload a photograph straight from a camera at several thousand pixels wide, then display it in a container only a few hundred pixels across.
The browser still has to download the large file.
Common image problems include:
- Files much larger than required
- Incorrect dimensions
- Poor compression
- Loading every image immediately
- Serving desktop-sized images to mobile devices
Image optimisation often produces noticeable improvements without changing the appearance of the site.
Third-party scripts
Third-party tools can add a surprising amount of work to a webpage.
Examples include:
- Live chat
- Analytics
- Advertising pixels
- Tag managers
- Booking systems
- Review widgets
- Heatmaps
- Cookie-management platforms
- Social embeds
One script may not be a problem.
The issue is accumulation.
A website can start with a clean build and gradually become slower as new marketing tools are added over several years.
Regularly ask:
Do we still use this?
If nobody knows why a script exists, it deserves investigation.
JavaScript
Large amounts of JavaScript can delay rendering and make interactions feel sluggish.
Problems can include:
- Large bundles
- Long-running tasks
- Unnecessary libraries
- Scripts loaded before they are needed
- Complex third-party widgets
The goal is not to remove JavaScript.
It is to avoid making the browser perform unnecessary work before the visitor can use the page.
Render-blocking resources
Some CSS and JavaScript resources need to be downloaded and processed before the browser can display important content.
Too many blocking resources can delay what the visitor sees.
Developers may improve this by:
- Loading critical resources earlier
- Deferring non-essential scripts
- Removing unused code
- Optimising CSS delivery
The exact fix depends on the site rather than a universal checklist.
Slow server response
Sometimes the problem happens before the browser has much to render.
Slow server response can come from:
- Poor hosting
- Slow database queries
- Heavy CMS configurations
- Missing caching
- Overloaded servers
- Excessive backend processing
If the server takes too long to start delivering the page, optimising images alone will not solve the problem.
Too many plugins
Plugins are not inherently bad.
But each plugin can introduce:
- JavaScript
- CSS
- Database queries
- Third-party requests
- Additional HTML
A WordPress site with dozens of plugins may be loading resources that are barely used.
Review plugins by function rather than assuming every installed plugin still needs to remain.
Web fonts
Custom fonts can affect both loading and visual stability.
Problems commonly come from:
- Too many font families
- Too many font weights
- Large font files
- Fonts loaded from slow external services
- Poor fallback configuration
Use the fonts the design genuinely needs rather than loading every possible variation.
Images and page speed
Because images are such a common bottleneck, they are a sensible place to begin an investigation.
Useful improvements can include:
- Resize images to appropriate dimensions
- Compress files before uploading
- Use responsive image sizing
- Use efficient formats such as WebP or AVIF where appropriate
- Lazy-load images that start below the fold
- Avoid lazy-loading the main above-the-fold image when it harms LCP
The objective is not simply:
“Convert every image to WebP.”
The objective is to send the browser an appropriately sized image efficiently.
Improving Largest Contentful Paint
If Core Web Vitals show poor LCP, identify the actual LCP element first.
It may be:
- A hero image
- A large heading
- A banner
- A content block
Then investigate why it appears late.
Possible fixes include:
- Compressing the image
- Serving a smaller image
- Improving server response
- Reducing render-blocking resources
- Making the important resource discoverable earlier
- Preloading a critical hero image where appropriate
Do not preload every large image on the page.
Preloading is useful when the browser genuinely needs help discovering an important resource earlier.
Improving Interaction to Next Paint
Poor INP often points towards too much browser work around interactions.
Check:
- Heavy JavaScript
- Third-party widgets
- Complex event handlers
- Long-running main-thread tasks
- Large menus or filters
- Booking systems
- Chat tools
Possible improvements include:
- Removing unnecessary scripts
- Breaking long tasks into smaller pieces
- Deferring non-essential work
- Simplifying expensive interactions
A page can look fully loaded and still feel slow if buttons or menus do not respond quickly.
Improving Cumulative Layout Shift
CLS problems occur when visible content moves unexpectedly.
Common causes include:
- Images without dimensions
- Ads without reserved space
- Embeds loading late
- Cookie banners pushing content
- Fonts changing text size after loading
Useful fixes include:
- Set width and height on images
- Reserve space for embeds
- Avoid injecting content above existing content
- Improve font-loading behaviour
A stable page feels faster even when the download time has not changed.
Page speed and third-party scripts
Third-party scripts deserve their own review because they often sit outside the normal development process.
A developer may optimise the site carefully.
Then, over time, different teams add:
- Analytics
- Advertising
- Chat
- CRM tracking
- Call tracking
- Review software
- Conversion tools
Each one has a reason to exist individually.
Together, they may create a major performance problem.
Audit them periodically and ask:
- Who owns this tool?
- Is it still being used?
- What does it contribute?
- Can it load later?
- Can it be removed?
The fastest resource is the one you no longer need to load.
Page speed and caching
Caching can reduce the amount of work required to serve repeat requests.
Depending on the site, this may include:
- Browser caching
- Page caching
- Object caching
- CDN caching
Caching can produce significant improvements when configured correctly.
But installing a caching plugin is not a complete performance strategy.
If the real problem is a 4 MB hero image or several heavy third-party scripts, caching does not remove those problems.
Diagnose first.
Then apply the appropriate fix.
When does a CDN help?
A content delivery network, or CDN, stores copies of assets closer to users in different locations.
It can be useful when:
- Visitors are geographically distributed
- The site serves many static assets
- Network latency is significant
- Traffic volume justifies it
For a local business serving one relatively small area, a CDN may still help, but it is not automatically the first performance improvement to make.
Images, scripts, server configuration and page construction may have a much larger effect.
Fix templates, not symptoms
Many performance issues come from shared templates or components.
If every service page uses the same:
- Hero component
- Navigation script
- Chat widget
- Font setup
- Booking embed
fixing the shared component can improve dozens or hundreds of pages at once.
This is usually more efficient than optimising URLs individually.
Ranksphere's smart tasks prioritise speed and technical findings by impact, helping separate meaningful performance problems from lower-priority recommendations.
Mobile page speed
Mobile deserves particular attention because the conditions are often less forgiving.
A visitor may be using:
- A mid-range phone
- Mobile data
- A congested network
- A weaker processor
Large images and heavy JavaScript that feel harmless on a modern laptop can become much more noticeable under those conditions.
This is especially relevant for local businesses, where someone may be trying to:
- Call immediately
- Find directions
- Book an appointment
- Request emergency help
- Check opening hours
Test the actual journey, not just the homepage score.
Page speed and mobile-first indexing
Mobile-first indexing means Google primarily uses the mobile version of a page's content for indexing.
That is separate from page-speed measurement, but both make mobile quality important.
A mobile page should not only contain the important content.
It should also be practical to use.
Do not think of mobile speed as:
“Google only cares about the mobile score.”
Think of it as:
“A significant number of real visitors are on mobile devices, so mobile performance needs to work under real conditions.”
Page speed and conversions
Ranking is only part of the reason to care about performance.
A slow site adds friction to whatever action the visitor is trying to complete.
That could be:
- Buying a product
- Completing a form
- Calling the business
- Booking an appointment
- Reading an article
- Finding an address
The exact effect on conversion rate varies by website, audience and task, so avoid assuming a specific performance improvement will produce a fixed increase in sales.
What is much safer to say is that removing unnecessary delay improves the experience and reduces one source of friction.
What should you fix first?
Do not work through performance recommendations alphabetically.
Start with the issue creating the largest real-user problem.
A sensible process is:
- Check field data to see which Core Web Vital or page type is struggling.
- Use lab tools to diagnose the likely cause.
- Identify whether the issue is template-wide or page-specific.
- Fix the highest-impact bottleneck first.
- Test the change immediately in the lab.
- Monitor field data over the following weeks.
The fix might be an image.
It might be JavaScript.
It might be the server.
Measure before deciding.
Common page speed mistakes
- Optimising for a perfect score. Tool scores are diagnostic aids, not the business objective.
- Treating Lighthouse as real-user data. It is a lab test.
- Testing only on a powerful desktop computer.
- Assuming images are always the problem. They are common, not universal.
- Installing a caching plugin and considering the job finished.
- Ignoring third-party scripts.
- Preloading too many resources. Overuse can compete with resources that genuinely matter.
- Optimising individual pages when a shared template causes the problem.
- Expecting field data to update immediately.
- Chasing tiny speed gains while serious crawling or indexing problems remain unresolved.
Page speed best practices
- Use field data to understand real-user performance.
- Use Lighthouse and similar lab tools for diagnosis.
- Optimise images before serving unnecessarily large files.
- Review third-party scripts regularly.
- Remove plugins and resources that are no longer needed.
- Improve server performance when response time is the bottleneck.
- Fix shared templates and components where possible.
- Test on real mobile devices and realistic connections.
- Monitor Core Web Vitals rather than relying on one performance score.
- Allow the 28-day field-data window time to reflect improvements.
- Prioritise changes that make the site noticeably better for visitors.
Example
“Penhurst Garden Centre runs Lighthouse and receives a strong performance score.
From the office, the website also feels reasonably fast.
But real-user data shows that mobile visitors are experiencing poor loading performance.
A closer review finds that the original website build is not particularly heavy.
The problem has accumulated over time.
The site now loads:
- A live-chat widget
- Multiple analytics scripts
- Advertising tracking
- A booking embed
- An external review carousel
- A cookie-management platform
- Several custom font resources
Some of those tools are still valuable.
Others have not been used for months.
The team audits each one, removes unnecessary scripts and delays non-critical resources until they are actually needed.
The design barely changes.
What changes is the amount of work a visitor's browser has to perform before the page becomes useful.
Lab testing confirms the technical improvement immediately, while the real-user field data changes more gradually as the 28-day reporting window updates.
That is the right way to approach page speed: do not optimise the score for its own sake. Identify what is slowing real visitors down, remove the bottleneck and measure whether their experience actually improves.”
See also
- Core Web Vitals — metrics for loading, responsiveness and visual stability
- Mobile-first indexing — how Google primarily processes the mobile version of content
- Technical SEO — the wider discipline covering website performance, crawling and indexing
- Google Search Console — where Core Web Vitals field data can be monitored
- Conversion rate — the percentage of visitors who complete a desired action
- Site architecture — how pages are structured and connected across the website