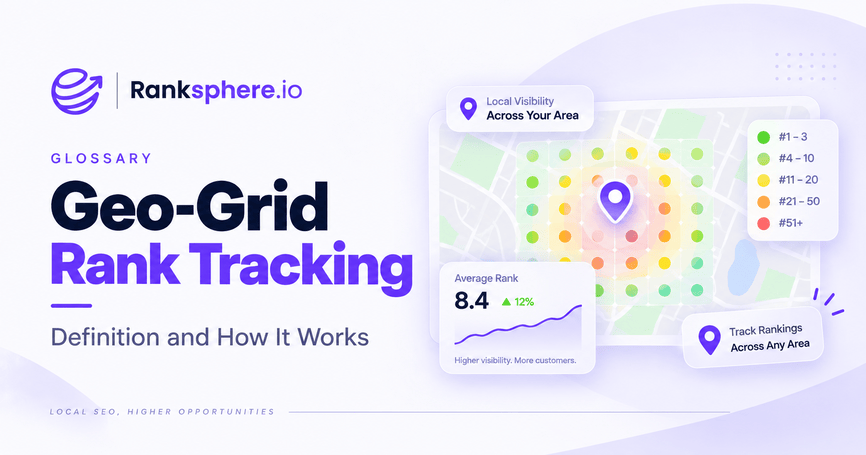
It exists because local rankings do not work like organic ones. There is no single position for “dentist near me” — there is a different answer at every point on the map, driven largely by where the searcher is standing. A traditional rank tracker reports one of those answers and presents it as the answer, which is how businesses end up believing they rank first when they are invisible two miles away.
Why geo-grid tracking matters
The practical problem it solves is a reporting one. A single-point tracker checking from the business address will almost always return a flattering number, because proximity is working in your favour at your own front door. That number tells you nothing about the searchers you are losing.
A grid scan shows the shape of the problem. It answers questions a list of rankings cannot: which neighbourhoods do we own, where does the competition take over, is our visibility growing outward or shrinking inward.
- Reveals coverage across a service area instead of one convenient point
- Makes competitive boundaries visible — you can see where a rival takes over
- Turns local SEO progress into something a client can understand at a glance
- Identifies which areas are worth targeting and which are out of realistic reach
How a grid scan works
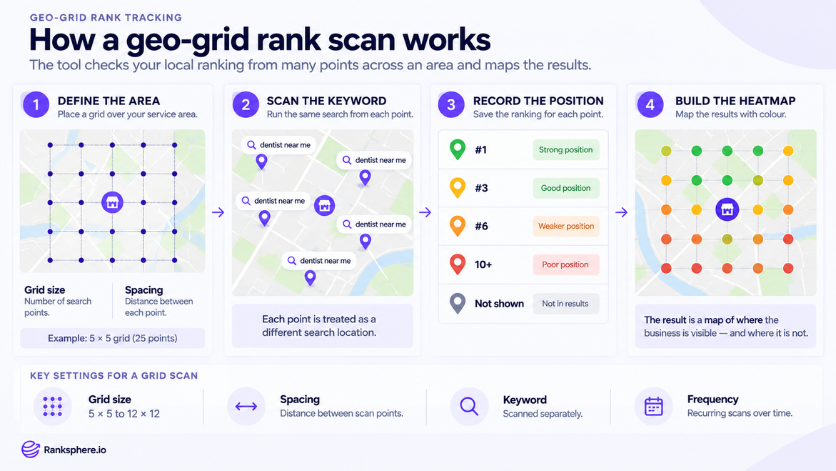
The tool places a grid of points over a map around your business. At each point it runs the keyword as though the searcher were standing there, records your position in the local pack, and plots the result.
Each point gets a colour: strong positions green, weak ones red or absent. The finished picture is a heatmap of your visibility.
- Grid size — commonly 5×5 for a quick read, up to 12×12 for detailed work
- Spacing — the distance between points, from a few hundred metres in a dense city to several miles for a wide service area
- Keyword — each term is scanned separately, since coverage differs by keyword
- Frequency — recurring scans on a schedule, so movement is visible over time
Grid size and spacing together define the area covered. A 7×7 grid at one mile spacing covers roughly six miles across; the same grid at 0.25 miles covers a mile and a half. Match the area to the business, not the other way round.
What to measure
The heatmap is the interesting part, but it needs numbers behind it for reporting.
- Top-three coverage — how many grid points return a top-three position. The most useful single figure, because top three is what the pack shows.
- Average position across the grid — useful as a trend, misleading on its own
- Share of local voice — your visibility across the grid relative to competitors
- Change between scans — direction matters more than any single snapshot
Ranksphere's local rank tracker runs grid scans from 5×5 up to 12×12, with recurring schedules, competitor tracking and date-to-date comparison so you can see movement rather than a static picture.
Common mistakes
- Setting the grid too wide. Points twenty miles out will always be red. They add noise, consume credits and depress your averages for no reason.
- Setting it too tight. A grid that only covers your own block tells you what you already knew.
- Reading average position as the headline. Coverage is the honest metric.
- Scanning daily and reacting to noise. Local results fluctuate; weekly or fortnightly is usually enough.
- Tracking one keyword. Coverage for “dentist” and “emergency dentist” can look completely different.
- Comparing scans with different grid settings. Change the size or spacing and the numbers are no longer comparable.
Best practices
- Size the grid to the realistic service area, then leave the settings alone
- Track a small set of keywords that genuinely matter rather than everything
- Report top-three coverage as the headline figure
- Scan on a fixed schedule so comparisons are clean
- Include at least one competitor to give the numbers context
- Use the heatmap in client reporting — it communicates in seconds what a table cannot
Example
“Beacon Hill Dermatology reports a first-place ranking for “dermatologist” to its board every quarter. The number comes from a standard rank tracker checking from the practice address.
The first grid scan — 7×7, one mile spacing — shows top-three positions at nine of forty-nine points, all within about two miles of the clinic. The northern third of the grid is solid red. A competing practice holds most of it.
The reporting changes to top-three coverage, currently 18%. Over two quarters the team focuses on review volume and completes the services list on the profile. Coverage reaches 41%. The board now sees a number that moves in line with actual patient enquiries, rather than one that was always going to say first.”
See also
- Local pack — what grid scans are measuring position within
- Share of local voice — a competitive metric derived from grid data
- Local ranking factors — why position changes across a grid
- Rank tracking — the traditional single-position approach
- Local SEO — the broader discipline this measures
- Multi-location SEO — where overlapping grids need careful reading