Engagement rate is the percentage of sessions in Google Analytics 4 that qualify as engaged sessions.
A session counts as engaged when it meets at least one of these conditions:
- It lasts longer than 10 seconds
- It contains at least one key event
- It includes two or more page or screen views
Google Analytics calculates engagement rate as:
Engaged sessions ÷ Total sessions × 100
GA4 bounce rate is the opposite:
the percentage of sessions that were not engaged.
That makes engagement rate useful for understanding whether people did more than arrive and leave immediately.
But it is not a website quality score.
A session can be engaged without producing a lead, and a valuable customer action can be missed if the important interaction has not been tracked properly.
What is an engaged session?
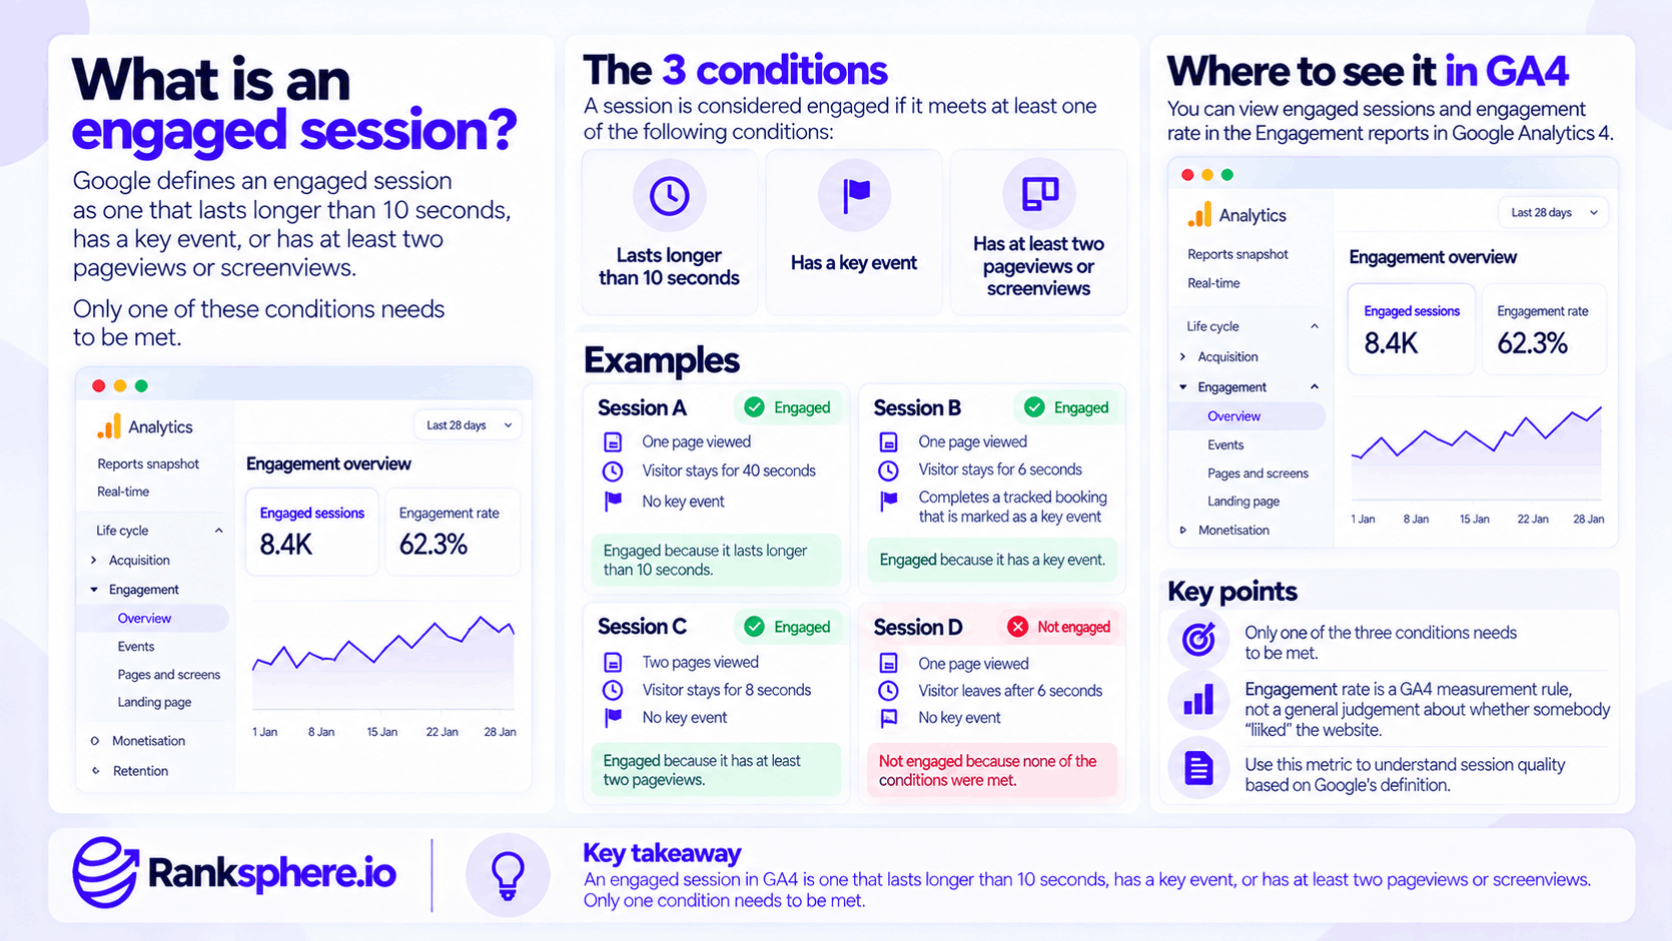
Google defines an engaged session as one that:
- Lasts longer than 10 seconds
- Has a key event
- Has at least two pageviews or screenviews
Only one of those conditions needs to be met.
For example:
Session A
One page viewed.
Visitor stays for 40 seconds.
No key event.
Engaged.
Session B
One page viewed.
Visitor stays for six seconds.
Completes a tracked booking that is marked as a key event.
Engaged.
Session C
Two pages viewed in eight seconds.
No key event.
Engaged.
Session D
One page viewed.
Visitor leaves after six seconds.
No key event.
Not engaged.
This is why engagement rate needs to be understood as a specific GA4 measurement rule rather than a general judgement about whether somebody “liked” the website.
How engagement rate is calculated
The formula is straightforward:
Engagement rate = Engaged sessions ÷ Total sessions
Suppose a site records:
1,000 sessions
and:
620 engaged sessions
The engagement rate would be:
62%.
The remaining:
38%
would represent GA4 bounce rate, because bounce rate is the inverse of engagement rate.
GA4 bounce rate
In GA4:
Bounce rate = Non-engaged sessions ÷ Total sessions
So if engagement rate is:
62%
bounce rate is:
38%.
This relationship is exact under GA4's current definitions.
That was not how Universal Analytics bounce rate worked.
Engagement rate vs Universal Analytics bounce rate
This is where historical reporting often goes wrong.
Universal Analytics defined a bounce as a session that generated only one request to the Analytics server.
A common example was somebody landing on a page and leaving without triggering another interaction.
But it was not simply:
one page viewed = bounce
in every circumstance.
A visitor could remain on one page and trigger an interaction event.
That additional interaction could prevent the session from being counted as a bounce even though no second page was viewed.
GA4 uses a different model.
It asks whether the session met one of its engagement conditions.
That means you should not directly compare:
Universal Analytics bounce rate in 2022
with:
GA4 engagement rate or bounce rate in 2026
as though they are versions of the same historical metric.
They are calculated differently.
Did engagement rate replace bounce rate?
It is more accurate to say that GA4 introduced engagement rate as its positive engagement metric.
GA4 also provides bounce rate.
The two are opposites:
Engagement rate + Bounce rate = 100%.
So bounce rate has not disappeared.
It simply means something different from the old Universal Analytics version.
For reporting, engagement rate is often easier to explain because:
65% engagement
describes sessions that met an engagement condition, rather than focusing on the sessions that did not.
The engagement-time threshold can be changed
GA4 uses a default threshold of:
10 seconds
for the time-based engaged-session condition.
However, Google allows administrators to change the timer used to determine when a web session becomes engaged. This setting lives within the web data stream configuration.
That matters when comparing two properties.
Suppose:
Website A
Uses the default engagement timer.
Website B
Uses a longer threshold.
Their engagement rates are not being calculated under identical settings.
Before benchmarking properties against each other, check their configuration.
Do not confuse session timeout with the engagement timer
GA4 also has a separate session timeout setting.
By default, sessions time out after 30 minutes of inactivity, although this can also be changed.
These are different settings.
Engagement timer
Helps determine whether the session qualifies as engaged.
Session timeout
Determines how long inactivity can continue before Analytics ends the session.
Changing one is not the same as changing the other.
Why engagement rate can be more useful than old bounce rate
One advantage of GA4's model is that a meaningful single-page visit can qualify as engaged through time or a key event.
For example:
Someone lands on a detailed service page.
They remain on the page for two minutes reading it.
They then leave.
Under GA4, the session meets the time requirement and counts as engaged.
That gives more context than treating every single-page visit as inherently poor.
But engagement rate still has limitations.
Engagement rate does not mean the visitor converted
Suppose someone:
- Reads three blog articles
- Spends ten minutes on the site
- Leaves without contacting the business
That session is clearly engaged under GA4.
But it produced no immediate commercial outcome.
Another visitor might:
- Land on a service page
- Click the phone number after six seconds
- Leave
If that phone interaction is tracked and marked appropriately as a key event, the session can qualify as engaged.
The two sessions have very different business meaning.
Yet both can count as:
engaged.
That is why engagement rate should sit alongside conversion rate, rather than replacing it.
Key events matter
Google defines a key event as an event that measures an action particularly important to the success of the business.
For a local service business, possible key events might include:
- Completed enquiry form
- Confirmed booking
- Important phone-button interaction
For an ecommerce site:
- Purchase
- Checkout completion
For a SaaS product:
- Trial registration
- Account creation
The exact set should reflect the business.
An event is not automatically a key event
GA4 can collect many events.
Examples include:
- Page loads
- Clicks
- Purchases
- Video interactions
An event only becomes a key event when it is configured or identified as important for the business.
This distinction matters because:
any random event does not automatically make the session engaged through the key-event condition.
The condition specifically requires a key event.
Phone taps and engagement rate
Local-business websites frequently rely on phone calls.
Suppose someone searches for an emergency plumber.
They land on the page.
The number is visible immediately.
They tap it after six seconds.
Then they leave.
From the customer's perspective, the page may have done exactly what it needed to do.
But measurement depends on configuration.
If:
- The session stayed under the engagement-time threshold
- Only one page was viewed
- The phone click was not recorded as a key event
the session may be classified as not engaged.
That is a measurement issue worth fixing.
Track phone interactions properly
If phone-button clicks are important to the business, track them as an event.
Where they represent a meaningful action, consider marking that event as a key event.
But label the metric accurately.
A phone tap does not prove that:
- The call connected
- Somebody answered
- The caller was qualified
- Revenue resulted
For that level of reporting, use:
- Call tracking
- CRM data
- Booking or sales data
Engagement tracking tells you the button was used.
Not what happened afterwards.
Quick answers can still create short sessions
Some pages are designed to solve a problem quickly.
For example:
- Contact page
- Opening-hours page
- Emergency service page
- Directions page
A short session is not automatically a bad session.
Someone might find:
the phone number
in four seconds and leave.
Someone else might spend:
three minutes
looking unsuccessfully for it.
Time alone cannot tell you which experience was better.
This is why behaviour metrics need business context.
Single-page websites are not automatically low-engagement
The original idea that single-page websites have low engagement “by construction” goes too far.
A single-page site can still record engaged sessions if visitors:
- Stay beyond the engagement threshold
- Trigger a key event
The limitation is that it cannot rely on multiple pageviews as easily as a conventional multi-page website.
Good event tracking therefore becomes more important.
Fast service pages are not automatically penalised
Likewise, engagement rate does not inherently punish pages for answering quickly.
If a useful action such as:
- Booking
- Form submission
- Phone interaction
is tracked as a key event, a short visit can still qualify as engaged.
The measurement problem appears when the customer completes a meaningful action that Analytics does not know about.
Engagement time is different from session duration
GA4 also reports engagement-time metrics.
Google defines user engagement as the amount of time the webpage was in focus or the app was in the foreground.
That is useful because a browser tab left open in the background should not automatically look like active reading.
So keep these concepts separate:
Engagement rate
Percentage of sessions meeting GA4's engaged-session criteria.
Engagement time
Time the website was in focus or app was active in the foreground.
Session duration
Length of the broader Analytics session.
They answer different questions.
Engagement rate is not an SEO ranking factor
Do not turn engagement rate into:
“Google sees a 75% engagement rate and rewards the page.”
GA4 is an analytics product.
Its engagement rate is a reporting metric.
There is no published Google Search rule saying:
higher GA4 engagement rate = higher rankings.
Use it to understand visitors.
Not as a ranking score.
Engagement rate is not a content-quality score
A high engagement rate may occur because people:
- Read useful content
- Navigate deeper
- Complete key actions
But it can also occur because:
- The site is confusing
- A task takes longer than necessary
- Users need several pages to find an answer
Likewise, low engagement does not automatically mean:
bad content.
It may reflect:
- Fast customer journeys
- Measurement gaps
- Page purpose
- Traffic quality
Interpret the reason behind the metric.
Engagement rate and page speed
Performance can influence behaviour.
A slow website may cause visitors to leave before they can interact.
Likewise, poor mobile layout can make:
- Forms difficult to use
- Buttons difficult to tap
- Content difficult to read
Ranksphere's website audit checks mobile rendering and performance, which can help identify technical issues that may contribute to poor user behaviour.
But do not infer:
low engagement = slow website
without testing.
It is one possible cause.
Segment before interpreting engagement rate
A site-wide engagement rate can hide very different user journeys.
Suppose the overall figure is:
55%.
That might contain:
Blog
75%
Emergency service page
40%
Homepage
60%
Careers page
80%
The average tells you little about why those numbers differ.
Analyse the segments that matter.
Segment by landing page
Landing-page segmentation is particularly useful.
Ask:
- Which pages start sessions?
- Which pages are unusually high or low?
- What is each page supposed to achieve?
A contact page and a 3,000-word guide should not necessarily behave alike.
Segment by channel
Users from:
- Organic Search
- Paid Search
- Social
may arrive with very different intentions.
Google itself recommends using reports and explorations to determine whether low engagement is concentrated in certain channels, source/medium combinations or pages.
Segment by device
Mobile and desktop behaviour can differ substantially.
A local customer on mobile may want:
Call now
while a desktop visitor may:
- Compare services
- Read multiple pages
- Complete a longer form
Comparing the two can expose usability or journey differences.
Segment by new and returning users
Returning customers may behave differently from first-time visitors.
For example:
A returning patient may open a clinic's website only to find the number.
A new patient may:
- Read treatments
- Check prices
- View the team
- Visit the contact page
A blended engagement rate hides those differences.
Avoid universal engagement-rate benchmarks
Statements such as:
“Anything under 50% is poor.”
are rarely useful.
Engagement rates depend on:
- Site type
- Page purpose
- Traffic source
- Device
- Key-event configuration
- Engagement timer setting
Two businesses can have very different rates while both websites are working well.
Benchmark against:
- Your own historical data
- Similar pages on your own site
- Comparable segments
before using an external average.
Configuration affects the number
This is one reason cross-site benchmarking is weak.
Imagine two plumbing websites.
Both receive identical visitor behaviour.
Site A
Tracks phone-button clicks as key events.
Site B
Does not.
Site A can report a higher engagement rate even though the visitors behaved identically.
The difference is measurement.
Not necessarily user experience.
Changing the engagement timer breaks comparability
Because the engaged-session timer can be changed in GA4, historical comparisons need configuration context.
If you change the threshold during the year, do not casually compare:
before
with:
after
as though the metric definition remained identical.
Document configuration changes.
This is particularly important for agency reporting where multiple people may manage the property.
Configure measurement before judging behaviour
Before diagnosing the engagement rate, check:
- Is GA4 installed correctly?
- Are important events firing?
- Are key events configured appropriately?
- Are forms tracked?
- Are phone interactions tracked?
- Are booking completions tracked?
- Has the engaged-session timer been changed?
Google itself recommends checking measurement implementation when low engagement appears broadly across a property.
A broken measurement setup can make a perfectly usable website look poor.
Engagement rate and conversion rate
Engagement rate answers:
Did the session meet one of GA4's engagement conditions?
Conversion rate answers a different question:
Did the visitor complete the business action being measured?
For most commercial websites, the second question is closer to the outcome.
A useful reporting hierarchy might therefore be:
Outcome
Bookings, leads, purchases
Conversion efficiency
Conversion or key-event rate
Behaviour
Engagement rate, engagement time
Traffic
Sessions, users
Each provides context.
Do not ask engagement rate to do all four jobs.
Engagement rate and organic traffic
When reviewing organic traffic, engagement rate can help show whether search visitors interact differently from visitors from other channels.
For example:
Organic Search may produce:
- Fewer sessions
- Higher engagement
- More conversions
than social traffic.
That can be commercially more important than traffic volume alone.
But again, engagement does not equal conversion.
Report both.
Engagement rate and content
For informational content, engagement rate can help identify pages worth reviewing.
Suppose several related guides perform around a similar range and one is dramatically lower.
That is worth investigating.
Possible reasons include:
- Poor intent match
- Misleading search snippet
- Slow loading
- Weak mobile usability
- Unhelpful introduction
- Measurement issue
Do not automatically rewrite the page because:
engagement rate is low.
Use the number to find the question.
Then investigate the page.
Look at outliers, not just averages
One of the most useful applications of engagement rate is identifying unusual behaviour.
For example:
If comparable service pages have:
- 64%
- 67%
- 62%
- 31%
the 31% page deserves inspection.
That does not prove something is wrong.
It tells you where to look.
This is more useful than attempting to push the entire website from:
57% to 60%
without understanding why.
Engagement rate can rise for the wrong reason
A higher number is not automatically better.
Imagine a booking form that previously took:
30 seconds
but, after a usability problem appears, takes:
five minutes.
Engagement time may increase.
That does not mean the experience improved.
Behaviour metrics need outcomes.
Engagement rate can fall for a good reason
The reverse can also happen.
Suppose a service page redesign makes the:
Book appointment
button immediately visible.
People complete the task faster.
Some behavioural metrics may decline while conversion improves.
That is why optimisation should focus on the intended customer action rather than maximising time or engagement for its own sake.
Common engagement-rate mistakes
- Comparing GA4 engagement rate directly with Universal Analytics bounce rate.
- Describing Universal Analytics bounce rate as every single-page session regardless of other interactions.
- Assuming GA4 bounce rate uses the old Universal Analytics definition.
- Treating engagement rate as a Google Search ranking factor.
- Using engagement rate as a general website-quality score.
- Assuming every short session is bad.
- Assuming every long session is good.
- Failing to track important actions such as phone interactions or bookings.
- Calling every tracked phone tap a completed lead.
- Comparing sites without checking their engaged-session timer and key-event configuration.
- Using universal industry benchmarks without considering page purpose and setup.
- Optimising a site-wide average instead of examining meaningful segments.
- Reporting engagement without conversions or other business outcomes.
Engagement-rate best practices
- Understand GA4's engaged-session definition before interpreting the metric.
- Configure important events and key events before drawing conclusions from engagement data.
- Track phone interactions, enquiry forms and bookings where they matter to the business.
- Keep phone taps separate from confirmed calls or qualified leads.
- Document any changes to the engaged-session timer.
- Segment by landing page, channel and device rather than relying on the site-wide average.
- Compare similar pages against your own historical data rather than chasing generic benchmarks.
- Use low or unusual engagement as a reason to investigate, not an automatic instruction to redesign.
- Read engagement rate alongside conversion rate and actual business outcomes.
- Use page speed and mobile usability data when technical problems may be affecting behaviour.
- Treat engagement as diagnostic context rather than the final KPI.
Example
“Consider a hypothetical plumbing company called Aldermoor Plumbing.
Its agency reviews the website and sees that the emergency call-out page has a noticeably lower engagement rate than several other service pages.
The immediate reaction could be:
“This page is performing poorly.”
But the team looks at the customer journey first.
Someone with a burst pipe searches for an emergency plumber.
They land on the page.
The phone number is immediately visible.
They tap it after six seconds and leave the website.
That is exactly the action Aldermoor wants.
But the Analytics setup has a problem.
The phone tap is not being recorded as an important event.
If that session:
- Lasts under the engagement threshold
- Contains only one pageview
- Has no key event
GA4 can classify it as not engaged.
The team therefore configures the phone-button interaction as an event and, because it represents an important customer action for the business, marks it as a key event.
From that point onwards, qualifying sessions containing the phone interaction can meet the key-event condition for an engaged session.
The team does not claim that:
- Engagement jumped from 22% to 78%
- Calls doubled
- Rankings improved
without real data.
More importantly, it also does not call every phone tap:
a confirmed lead.
Instead, the reporting now distinguishes:
Engagement rate
Phone-button key events
Connected or qualified calls, where call-tracking data is available
Nothing about the service itself needed to change.
The measurement needed to reflect what a successful visit actually looked like.
That is the right way to use engagement rate:
as a GA4 behavioural signal that helps you understand sessions, not as a universal score for page quality or business performance. A useful session can be short, a long session can be unproductive, and the metric only becomes meaningful when the actions that matter to the business are being measured properly.”
See also
- Google Analytics 4 — where engagement rate and engaged sessions are measured
- Conversion rate — whether visitors complete the actions that matter
- Bounce rate — the inverse of engagement rate in GA4, but different from the old Universal Analytics definition
- Organic traffic — the sessions being analysed
- Page speed — one possible technical cause of poor visitor behaviour
- KPI — choosing metrics that reflect business outcomes rather than behaviour alone