Average position is a Google Search Console metric showing the average position of your site's topmost result across the impressions recorded during the selected period.
It is useful for understanding search-performance trends.
It is not the same thing as saying:
“We rank at position 6.”
A site may appear at different positions depending on:
- Query
- Location
- Device
- Date
- Search-result layout
Search Console combines those recorded appearances into an average unless you filter the report more narrowly.
That means an average position of:
6.4
does not necessarily mean anyone ever saw the site in exactly position 6.4.
Google itself describes position as a complex metric and recommends looking at changes over time rather than relying too heavily on an isolated number.
What does average position mean?
Google Search Console records a position when your site receives an impression in Google Search.
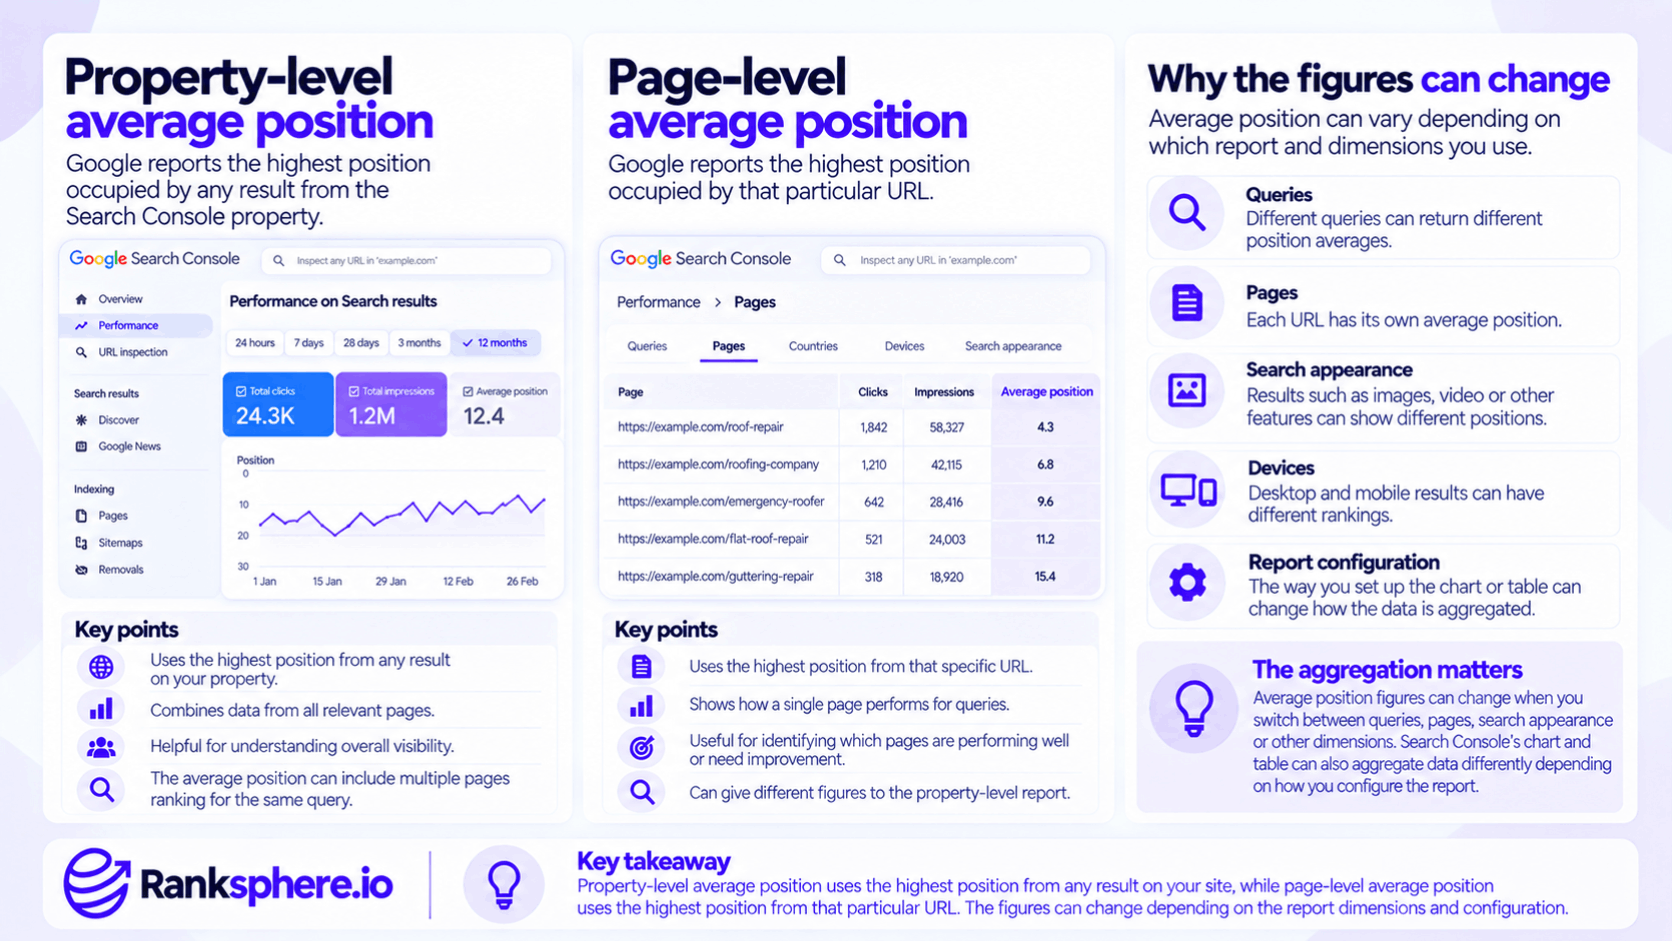
If several results from the same Search Console property appear for one search, Google normally uses the topmost position when data is aggregated by property.
For example:
Your site appears at:
- Position 2
- Position 5
- Position 8
For that impression, the property's position is:
2
Google then averages those topmost recorded positions across impressions.
Property-level vs page-level average position
The aggregation matters.
Property level
Google reports the highest position occupied by any result from the Search Console property.
Page level
Google reports the highest position occupied by that particular URL.
This is why average-position figures can change when you switch between:
- Queries
- Pages
- Search appearance
or other report dimensions.
Search Console's chart and table can also aggregate data differently depending on how you configure the report.
Average position is based on impressions
Position is only recorded when an impression occurs.
Suppose your page technically appears on a later results page, but the searcher never reaches that set of results.
Google says no impression is recorded, so there is also no position value for that appearance.
That means average position is not:
the average of every theoretical ranking your site has.
It is:
the average position across the appearances that produced recorded impressions.
Average position is effectively impression-weighted
Imagine the same query produces these results:
- Position 3: 900 impressions
- Position 40: 100 impressions
The average will be much closer to 3 than 40 because there were far more recorded appearances at the stronger position.
That matters when interpreting location or device differences.
A market generating most of the impressions can dominate the overall average.
Location can change the result
Google says the result somebody sees may differ from the Search Console average because of variables such as:
- Location
- Search history
- Search context
This matters particularly for businesses competing in local search.
Someone searching near the business may see a very different result from somebody several miles away.
Device can change it too
Mobile and desktop searches can also produce different:
- Results
- Layouts
- Positions
If you look only at the overall average, those experiences are combined.
Filtering Search Console by device can therefore make the metric easier to interpret.
Average position is not an exact rank
This is the most important point.
If Search Console reports:
Average position: 7.2
do not report:
“We rank number seven.”
Those statements are not equivalent.
The first means:
Across the recorded impressions included in this report, the topmost relevant result averaged position 7.2.
The second implies:
Someone searching this keyword right now will find us seventh.
Search Console does not guarantee that.
Why your manual search may disagree
A common question is:
“Search Console says position 5, but I searched and we're position 9. Which one is wrong?”
Possibly neither.
Google explicitly notes that your individual search can differ from the Search Console average because of factors such as:
- Location
- Search history
- Other search conditions
One manual search is a snapshot.
Search Console is aggregated performance data.
Average position and local SEO
Average position becomes harder to interpret when the search itself is strongly location-dependent.
Google says local results are mainly based on:
- Relevance
- Distance
- Prominence
and specifically defines distance according to how far a business is from the person searching.
So a business may perform very differently across the same town or service area.
A single average cannot show that geography.
Example of the local problem
Imagine a veterinary practice.
For the query:
vet near me
it performs:
- Strongly around its own neighbourhood
- Moderately several miles away
- Poorly on the opposite side of the city
Search Console might reduce all of those impressions into:
Average position: 8.1
That figure is not necessarily wrong.
It just does not tell the business:
where it is actually visible.
That is the information local SEO often needs.
Why geo-grid tracking is different
Geo-grid rank tracking approaches local rankings geographically.
Instead of asking:
What is our one average position?
it can ask:
Where across the area are we visible?
A grid might show:
- Position 1 close to the business
- Position 3 slightly farther away
- Position 8 in another neighbourhood
- No top-three presence farther out
That geographic pattern can be much more useful for analysing local-pack coverage.
Ranksphere's rank tracker reports coverage and share of voice across your service area, helping show how visibility changes geographically rather than reducing the entire area to one number.
Search Console and geo-grid data are not substitutes
It is important not to position one as correct and the other as wrong.
They answer different questions.
Search Console
Shows how your website performed across real Google Search impressions.
Geo-grid tracking
Samples rankings from defined geographic points under controlled tracking conditions.
For a local campaign, they can complement each other.
Search Console shows actual search performance.
The grid shows spatial coverage.
Local pack and organic position should be separated
A local business may appear:
- In the local pack
- In normal organic results
for the same query.
Those are different search surfaces.
A business might perform strongly in one and weakly in the other.
Do not collapse them into:
“overall position 3.”
Track:
Local-pack position
and:
Organic position
separately.
That makes diagnosis much clearer.
SERP features complicate position
Google Search is not simply ten blue links.
A results page might contain:
- Ads
- AI Overviews
- Local results
- Featured snippets
- Images
- Videos
Search Console explains that a search-result element can occupy a position as a whole and that some visual elements have special counting rules. Ads do not occupy organic Search Console positions.
That means:
Position 3
does not always represent the same amount of screen space or visual prominence.
Position is not pixel depth
One result can occupy much more space than another.
A large rich result might occupy position 2.
A normal organic result might occupy position 3 underneath it.
Search Console's position value does not tell you:
- How many pixels down the page you appeared
- Whether you were above the fold
- How much attention the preceding elements received
Treat it as a relative search position.
Not a screen-coordinate measurement.
What average position is genuinely useful for
The metric is not useless.
Used carefully, it can be very helpful.
Tracking direction over time
Google itself recommends monitoring position changes over time, particularly meaningful or sudden changes.
For example:
Average position 26 → 11
for the same query under comparable conditions deserves investigation.
That is much more informative than obsessing over:
6.4 → 6.1
without any other context.
Query-level analysis
Filtering to one query makes average position more meaningful.
You have removed the variation created by completely different searches.
Then compare:
- Position
- Impressions
- Clicks
- CTR
over time.
That provides a much richer picture.
Page-level analysis
Likewise, filter to one page.
You can see whether a specific URL is:
- Reaching more queries
- Moving up or down
- Gaining impressions
- Gaining clicks
Again, position should not be read alone.
Device segmentation
If mobile performance is weaker than desktop, separate the two.
An overall average may hide that difference.
Search Console lets you segment performance by device.
Country segmentation
International sites should also avoid reading one global position as though every market behaves the same way.
Filter by country.
Then evaluate important markets separately.
Branded vs non-branded queries
Branded searches often produce very strong positions.
For example:
Stonegate Vets
may average around position 1.
A non-branded query such as:
vet near me
may perform very differently.
Blending the two can make the overall average look stronger than the non-branded discovery performance you actually want to measure.
That does not make branded queries artificial.
They are real searches.
It simply means the two segments answer different questions.
Position is more useful with impressions and clicks
Google's current Search Console guidance explicitly recommends focusing more on trends in:
- Impressions
- Clicks
than on position alone.
That is sensible.
Suppose:
Scenario A
Position improves:
9 → 5
Clicks rise:
200 → 450
That looks commercially meaningful.
Scenario B
Position improves:
9 → 5
Impressions collapse because demand disappeared.
Clicks fall:
200 → 80
The improved position does not tell the whole story.
Average position and CTR
Click-through rate gives another layer.
Suppose:
- Position remains broadly stable
- Impressions remain stable
- CTR falls
Possible explanations include:
- Search-result layout changed
- Competitor titles improved
- Your title changed
- A new SERP feature appeared
That is a very different diagnosis from:
our rankings collapsed.
Use the metrics together.
Finding near-opportunity pages
A common SEO workflow is to look for queries or pages with:
- Meaningful impressions
- Mid-ranking positions
- Commercial relevance
and investigate whether they can realistically improve.
Positions around the lower half of page one or beyond can sometimes provide useful opportunities.
But avoid making:
positions 5–15
a universal rule.
A query at position 12 with:
- 20,000 impressions
- Strong commercial relevance
may deserve attention.
Another at position 7 with:
- Five impressions
- No business relevance
probably does not.
Filter by opportunity, not position alone.
“Just off page one” needs context
Search results are no longer uniform enough for:
position 11 = page two = easy win
to tell the whole story.
SERP features, devices and result formats all influence what users actually see.
Use position as a starting point.
Then inspect the current SERP.
Small position movements can still matter
Avoid saying:
“One or two positions is always noise.”
For a high-volume commercial query, moving:
3 → 1
can be important.
Even:
5 → 4
may matter depending on the SERP.
The correct question is:
Did the change materially affect impressions, clicks or business outcomes?
Small numerical movement is not automatically meaningless.
Large movements deserve investigation
A substantial change is often easier to interpret.
For example:
28 → 9
is meaningful enough to investigate.
But even then, ask:
- Did impressions change?
- Did the query mix change?
- Did demand change?
- Did the page itself change?
Position alone still does not prove why the movement happened.
Average position and ranking volatility
Day-to-day ranking movement is normal.
Search Console can smooth some of that because it reports an average.
For important queries, compare:
- Longer periods
- Like-for-like dates
- Consistent filters
rather than reacting to isolated daily movement.
Google's Performance report now also supports weekly and monthly views intended to help smooth daily fluctuations.
Be careful comparing date ranges
If you compare:
Last 28 days
with:
Previous 28 days
make sure nothing major changed in:
- Device mix
- Countries
- Query demand
- Seasonality
An average can move because the underlying mix changed even if individual rankings were relatively stable.
This is one reason averages need segmentation.
What to report for local SEO instead
Average position can stay in the report.
It just should not be the only headline.
For local businesses, a stronger reporting set may include:
- Geo-grid coverage
- Share of local voice
- Organic clicks
- Click-through rate
- Local-pack visibility
- Profile actions
- Leads or bookings
These measure different parts of the customer journey.
Top-three grid coverage
For a local-pack campaign, top-three grid coverage can be particularly useful.
For example:
18 of 49 grid points show the business in the top three.
That describes geographic visibility more clearly than:
average rank 4.7
when local rankings vary heavily by location.
But coverage is still a third-party tracking metric.
It should be interpreted alongside real Business Profile and website performance.
Share of local voice
Share of local voice can help compare visibility across a defined local keyword and geographic set.
It is particularly useful for competitor analysis.
But remember that SoLV is a third-party metric whose formula depends on the tool.
It is not a Google metric.
Keep the:
- Grid
- Keywords
- Tracking settings
consistent when comparing it over time.
Profile actions
For local businesses, Google Business Profile performance can provide interaction metrics such as:
- Calls
- Website clicks
- Direction requests
- Bookings where supported
depending on the profile.
Those are closer to customer behaviour than average position.
But they also need proper interpretation.
A call-button click, for example, does not prove a completed or qualified phone call.
Average position is an input, not an outcome
Clients generally do not want:
position 4.2
for its own sake.
They want:
- Calls
- Enquiries
- Bookings
- Revenue
Rankings help explain how those outcomes may be produced.
They are not the outcome themselves.
That is why position belongs inside a wider performance story.
Common average-position mistakes
- Reporting average position as though it were a fixed rank.
- Ignoring that Search Console reports the topmost result for the selected aggregation.
- Forgetting that position is only recorded when an impression occurs.
- Assuming two locations contribute equally to the average when their impression volumes differ.
- Using one overall position figure for a geographically sensitive local campaign.
- Treating local-pack and organic position as the same metric.
- Assuming a Search Console average represents exactly what one searcher saw.
- Comparing averages across different filters without recognising that the underlying mix changed.
- Calling every one-position movement meaningless.
- Treating positions 5–15 as an automatic optimisation list without checking demand and business value.
- Blending branded and non-branded searches when the objective is specifically non-branded discovery.
- Reporting rankings without impressions, clicks or business outcomes.
Average-position best practices
- Treat average position as an aggregated performance metric, not a live rank.
- Segment by query, page, device and country where useful.
- Compare trends over time rather than obsessing over isolated snapshots.
- Read position alongside impressions, clicks and click-through rate.
- Separate branded and non-branded performance when that distinction matters to the objective.
- Use geo-grid rank tracking when you need to understand how local-pack visibility changes geographically.
- Track local-pack and organic visibility separately.
- Investigate commercially relevant mid-ranking queries rather than blindly optimising every result in a position band.
- Check the actual SERP before deciding what a position change means.
- Use leads, bookings and other business outcomes as the ultimate reporting layer.
Example
“Consider a hypothetical veterinary practice called Stonegate Vets.
Its existing rank tracker reports:
Position 1
for several important local keywords.
On paper, that looks excellent.
But enquiries have not changed much.
The team investigates.
The tracker had been checking from one location close to the clinic.
Google says distance is one of the main factors affecting local results, so a result measured close to the business does not necessarily represent customers searching elsewhere in the service area.
Search Console adds another perspective.
It shows an average organic position around:
7
for a group of relevant queries.
That figure is useful, but it still does not tell the team how local-pack visibility changes from one neighbourhood to another.
A geo-grid scan reveals a much more uneven pattern:
- Strong visibility around the clinic
- Moderate coverage in nearby areas
- Much weaker visibility farther away
The reporting is changed.
Instead of saying:
“We rank number one.”
the team now separates:
- Local-pack grid coverage
- Organic Search Console performance
- Clicks
- Business Profile interactions
- Enquiries
Search Console average position remains in the report as a trend metric.
It simply stops being presented as:
the business's ranking.
No fabricated improvement is added to the example.
Whether coverage later improves depends on many factors, including relevance, distance, prominence, competition and actual optimisation work.
The lesson is the measurement change itself:
average position tells you where your top result appeared on average across recorded impressions. It does not tell you where every customer sees you, and for local search it cannot replace geographic ranking data.
That is the right way to use it.”
See also
- Geo-grid rank tracking — showing how local rankings vary geographically
- Impressions — the appearances across which position is averaged
- Rank tracking — monitoring ranking visibility under defined conditions
- Share of local voice — comparing visibility across a consistent local grid
- Google Search Console — where average position is reported
- KPI — choosing metrics that reflect the actual objective