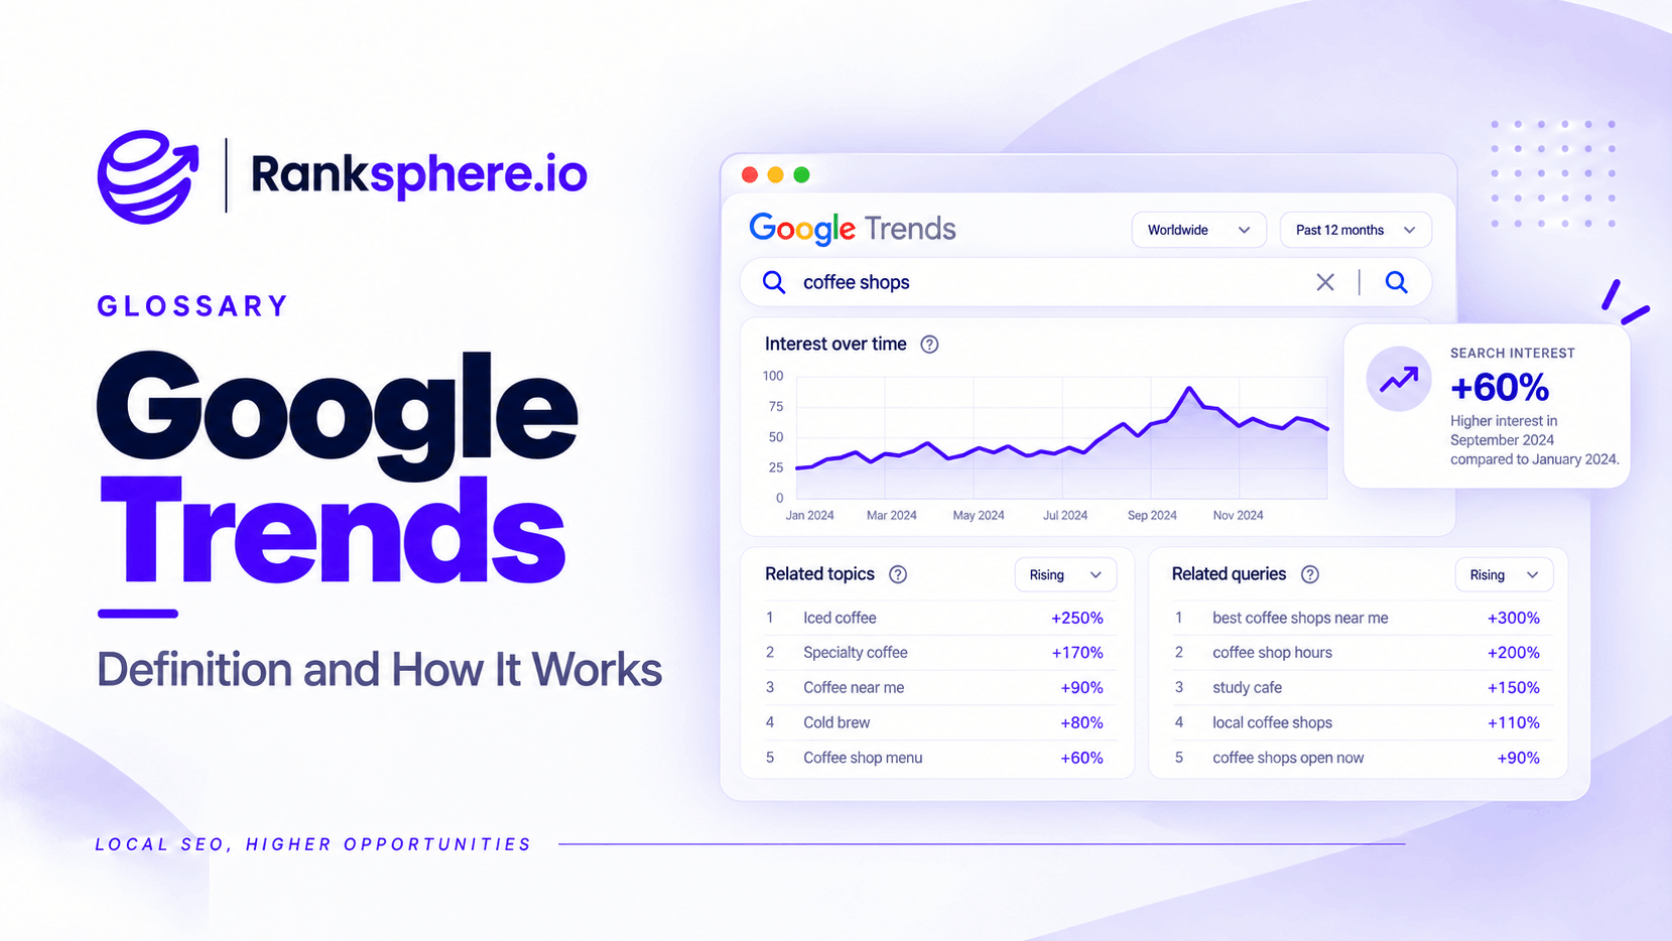
Google Trends is a free tool from Google that shows how search interest changes over time, across locations, and between different search terms.
It helps businesses understand when people are searching for particular products or services, which topics are becoming more popular, and whether demand follows a seasonal pattern.
For example, a garden centre could use Google Trends to see when interest in gardening products typically increases throughout the year.
The important thing to understand is that Google Trends doesn't show exact search volumes.
Instead, it uses a normalised scale from 0 to 100 to represent relative search interest.
A score of 100 doesn't mean a keyword receives thousands of searches. It represents the highest relative interest within the selected comparison, location, and timeframe.
That makes Google Trends useful for identifying patterns, but not for calculating precisely how many customers are searching for a service.
How Does Google Trends Work?
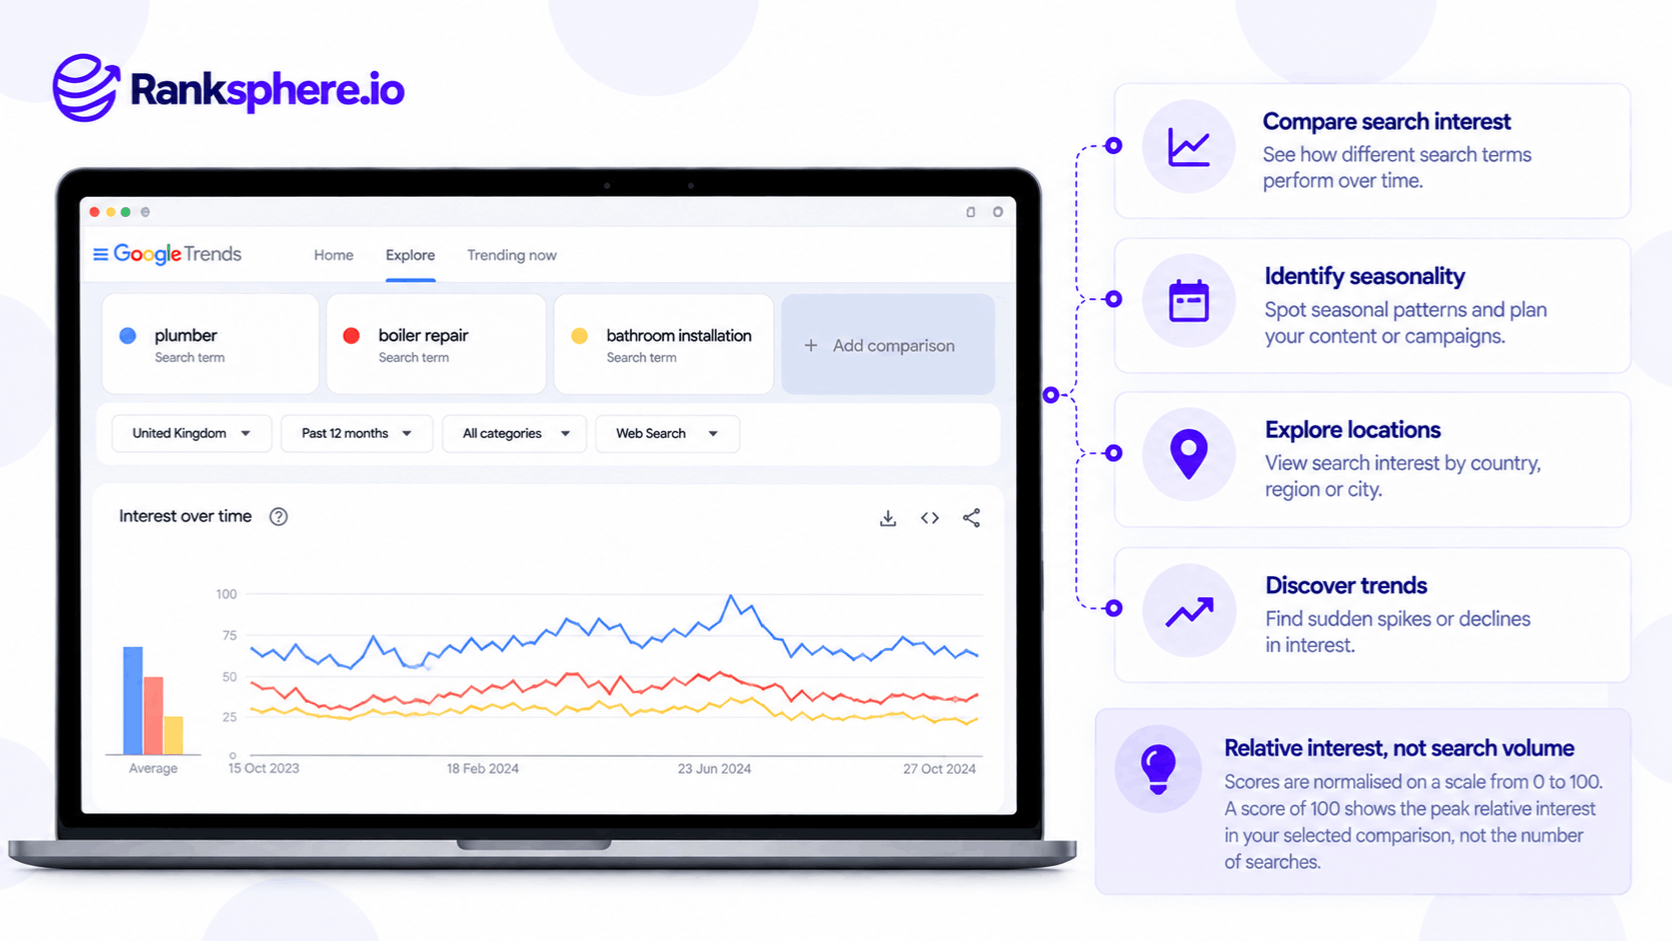
Google Trends analyses a sample of anonymised, aggregated Google search activity.
It adjusts the data according to the total number of searches within the selected geography and period.
The results are then presented on a scale from 0 to 100.
For example, imagine a business researching the term "boiler repair" over five years.
The chart may show:
- 100 during the period with the highest relative search interest
- 65 during a quieter period
- 30 during a period with substantially lower relative interest
These figures describe relative popularity, not the number of searches.
A score of 50 doesn't mean there were 50 searches.
It also shouldn't automatically be interpreted as an exact monthly search volume or a precise measure of customer demand.
What Does 100 Mean in Google Trends?
A value of 100 represents the peak relative search interest within the selected data.
It doesn't indicate a particular number of searches.
For example, a niche service and a widely searched consumer product can both reach 100 when viewed in separate charts.
That doesn't mean their search volumes are comparable.
The number only becomes meaningful when you understand the context in which it was calculated.
What Does 0 Mean?
A value of 0 doesn't necessarily mean nobody searched for the term.
Google may display 0 when search interest is too low to report reliably or when the normalised value is very small.
Google Trends uses sampled data and applies privacy protections, so less popular searches may not appear consistently.
This is especially important for local businesses researching narrow geographic areas.
Why Does Changing the Date Range Change the Numbers?
Google Trends recalculates its scale according to the selected timeframe.
For example, a search term viewed over twelve months may show a particular week as 100.
If you expand the chart to five years, an earlier period may become the highest point.
The more recent week's value may then appear lower.
That doesn't necessarily mean search interest changed between the two reports.
The comparison scale changed.
This is why Google Trends screenshots should always include the date range, location, and other relevant settings.
What Is Google Trends Useful for in SEO?
Google Trends is particularly useful for understanding changes in demand and comparing the relative popularity of search topics.
Identifying Seasonal Search Trends
One of its strongest uses is researching seasonality.
For example, a heating company might compare five years of interest in "boiler repair."
It may discover that searches tend to increase during colder months.
A landscaping company might see interest rise in spring and decline during winter.
These patterns can help businesses prepare content, marketing activity, and operational resources before demand increases.
However, seasonal patterns can change because of unusual weather, economic conditions, or changes in customer behaviour.
Google Trends provides historical context rather than a guaranteed forecast.
Comparing Search Terms
Businesses can compare different ways people describe a service.
For example, a roofing company might compare:
- Roof repair
- Roof repairs
- Roofing repair
Viewing terms together helps reveal differences in relative search interest.
This can support keyword research and content planning.
However, the business should also consider search intent.
A term with more search interest isn't automatically the best keyword for a service page.
Identifying Emerging Topics
Google Trends can reveal topics that are becoming more popular.
For example, a business may notice increasing interest in a particular home improvement service.
That could justify investigating whether customers are beginning to ask about it more frequently.
However, a temporary spike doesn't always indicate lasting demand.
Check whether interest continues over time before making major business or content decisions.
Investigating Market-Wide Changes
Suppose a local business experiences a decline in organic traffic.
Google Trends may help determine whether broader interest in the relevant service has also declined.
For example, if a heating contractor sees fewer website visits during a warmer-than-usual winter, Trends might show weaker regional interest in heating-related searches.
That would provide useful context.
However, Trends alone cannot prove that lower demand caused the website's traffic decline.
The business still needs to investigate rankings, impressions, clicks, and competing search results.
Comparing Regional Search Interest
Google Trends can show where a term is relatively popular.
For example, a company might compare interest in air conditioning services across different regions.
However, the regional values are normalised.
A smaller region can show stronger relative interest than a larger one while still generating fewer total searches.
This means regional Trends scores shouldn't be treated as a ranking of locations by absolute search demand.
The Limitations of Google Trends for Local SEO
Google Trends becomes less useful when analysing very specific services in small geographic areas.
For example, a roofing company might want to investigate searches for "flat roof repair" within a single town.
The query may not have enough search activity for Google Trends to display meaningful data.
That doesn't mean local customers aren't searching for the service.
It means the available Trends data is insufficient for that particular analysis.
Use Broader Locations Where Necessary
If town-level data is unavailable, try a wider geographic area.
For example, compare regional search interest rather than limiting the analysis to one town.
This may reveal a useful seasonal pattern.
However, don't assume the regional pattern applies identically to every locality.
Try Broader Search Terms
A specific service phrase may produce limited data.
For example, "emergency flat roof repair" may not show useful results within a small region.
A broader term such as "roof repair" might provide a clearer picture.
The trade-off is that the broader term may represent several different customer needs.
Account for Sampling and Noise
Google Trends uses sampled search activity rather than every search made on Google.
Google also explains that statistical noise can create small fluctuations, particularly for queries with little interest.
Avoid treating every small movement in the chart as a meaningful market change.
Look for recurring or sustained patterns supported by other evidence.
Google Trends vs Google Search Console
Google Trends and Google Search Console answer different questions.
| Google Trends | Google Search Console |
|---|---|
| Shows relative search interest | Shows search performance for your website |
| Useful for broader demand patterns | Useful for your actual queries and pages |
| Uses normalised, sampled data | Reports clicks, impressions and other search metrics |
| Can compare topics across regions | Measures how your verified site appears in Google Search |
| Doesn't provide exact keyword volume | Doesn't measure total market-wide demand |
For example, Google Trends might show that interest in garden maintenance typically falls during winter.
Search Console could show whether the garden centre's website experienced a similar decline in impressions and clicks.
Together, they provide better context than either tool alone.
However, Search Console impressions are not a complete measure of how many people searched for a term.
They reflect eligible appearances of the website in Google Search.
How to Use Google Trends for Local SEO
A practical approach is to start with the business's main services and investigate how search interest changes.
Step 1 — Choose a Relevant Search Term
For example, a plumbing company might start with "boiler repair."
Choose a term that represents a genuine service or customer need.
Step 2 — Select the Geographic Area
Set the country or region where the business operates.
If the available data is too limited, widen the geographic area.
Avoid interpreting sparse local data as proof of low demand.
Step 3 — Choose the Timeframe
A five-year view can help identify recurring seasonal patterns.
A twelve-month view can help investigate more recent movement.
Use the same settings when comparing results across reports.
Step 4 — Compare Related Terms
Add another relevant search term or topic.
For example, compare "boiler repair" with "boiler servicing."
Check whether the terms follow similar patterns and whether one has stronger relative interest.
Keep in mind that a search term and a Google Trends topic are not necessarily equivalent.
Topics can group related searches across languages and variations, while search terms are more closely tied to the selected wording.
Step 5 — Review Related Queries
Google Trends can reveal related and rising searches.
These may provide ideas for additional keyword research or content topics.
However, don't publish an article solely because a query appears to be rising.
Confirm that the topic is relevant to the business and that you can answer the user's needs.
Step 6 — Compare Against Your Own Data
Check whether Trends patterns align with:
- Search Console impressions and clicks
- Google Business Profile performance
- Customer enquiries
- Historical sales or booking data
- Local ranking measurements
Ranksphere's Local Rank Tracker helps businesses monitor their ranking visibility across selected geographic search points.
Used together, Trends and local rank tracking can help distinguish changes in broader search interest from changes in the business's ranking positions.
However, geo-grid ranking coverage is not the same as market share and doesn't measure total local search demand.
Other Tools to Use Alongside Google Trends
Google Trends isn't the only source of keyword research information.
For local businesses, other useful sources include:
Google Autocomplete
Google Autocomplete can reveal search phrases and questions related to a topic.
For example, typing "boiler repair" may produce suggestions that help identify how customers phrase their searches.
However, autocomplete suggestions don't provide reliable search volume figures.
Related Searches
Related searches may reveal additional topics and keyword variations.
These can help businesses identify supporting content opportunities.
Google Business Profile Performance
Google Business Profile performance data can provide information about how customers discover and interact with a business profile.
Available search term reporting can help identify queries associated with the profile.
However, it shouldn't be treated as a complete record of local market demand.
Keyword Research Tools
Dedicated keyword research tools can provide estimated search volumes and other data.
Those estimates also have limitations, but they can be more useful than Trends when approximate search demand is needed.
The strongest research combines several sources rather than relying on one metric.
Common Google Trends Mistakes
- Treating 100 as a search volume figure. It represents a relative peak.
- Comparing separately normalised charts. The scales may not be equivalent.
- Ignoring the selected date range. Changing the period changes the normalised values.
- Treating 0 as no searches. Low-volume queries may not have enough reportable data.
- Using regional scores as absolute demand. A region's relative interest doesn't reveal its total searches.
- Expecting detailed town-level information. Narrow local queries may produce insufficient data.
- Treating short-term spikes as lasting trends. Sudden interest may disappear quickly.
- Using Trends as proof of an SEO ranking problem. It measures relative search interest, not website rankings.
- Presenting charts without their settings. Results need geographic and time context.
- Choosing keywords solely by popularity. Search intent and business relevance still matter.
Google Trends Best Practices
- Use Google Trends to investigate seasonality and changing search interest.
- Compare relevant terms within the same chart.
- Record the date range, geography, category, and search type.
- Use broader regions when local data is too limited.
- Check multi-year patterns before drawing seasonal conclusions.
- Treat low-volume results cautiously.
- Cross-check Trends against Search Console and business data.
- Use rising searches as research ideas rather than guaranteed opportunities.
- Include seasonal findings during client onboarding.
- Explain the 0–100 scale when sharing results with clients.
The objective is to understand how search interest changes, not to turn relative scores into traffic forecasts.
Example of Google Trends in Local SEO Reporting
Consider a hypothetical garden centre that begins working with an SEO agency in August.
By November, organic traffic has declined.
The client is concerned because the agency has been improving the website during the same period.
What the Agency Investigates
The agency reviews several years of Google Trends data for gardening-related searches.
At a national or regional level, it finds a recurring pattern of stronger interest in spring and summer, followed by lower interest during late autumn and winter.
This suggests that seasonal demand may explain part of the decline.
However, the agency doesn't rely on Trends alone.
It also reviews the garden centre's historical Search Console performance.
What the Data Shows
Search Console reveals that the website experienced similar seasonal declines in previous years.
The agency then checks its local ranking data.
Several tracked keywords have maintained comparable rankings despite lower search impressions.
This suggests that reduced demand may be contributing to the traffic change rather than a widespread loss of search visibility.
However, it doesn't rule out other causes.
How the Agency Changes Its Reporting
The agency introduces year-on-year comparisons and explains the business's seasonal pattern.
Future reports include:
- Organic clicks and impressions
- Historical seasonal context
- Relevant keyword rankings
- Google Business Profile interactions
- Customer enquiries
The team also prepares seasonal content before the next period of higher interest.
Example
“Google Trends didn't tell the agency exactly how many people searched for gardening products.
It helped reveal a recurring demand pattern.
Combined with the garden centre's own historical data, that made the performance report more meaningful.
The agency could distinguish a possible seasonal decline from an SEO problem that required immediate correction.
Google Trends is most useful for understanding when and where interest changes, not how many searches a keyword receives.
For local businesses and SEO agencies, it provides context for keyword research, seasonal planning, and performance reporting. Its value is greatest when the relative data is interpreted carefully and compared with real website and customer information.”
See Also
- Seasonality — Understanding recurring changes in search demand.
- Search Volume — Estimating how often people search for particular terms.
- Keyword Research — Finding relevant queries and understanding search intent.
- Google Autocomplete — Discovering search predictions and related phrasing.
- Google Search Console — Measuring the search performance of your own website.
- Benchmark Report — Establishing historical context for SEO performance.