A key performance indicator, or KPI, is a metric selected to measure progress towards a specific business or marketing objective.
The important word is key.
Not every number in an SEO dashboard deserves to be called a KPI.
A useful KPI should help answer a business question such as:
- Are more potential customers finding us?
- Are more people contacting the business?
- Is local visibility improving?
- Are more visitors turning into enquiries?
- Is SEO contributing to revenue?
Metrics such as rankings, impressions, reviews and traffic can all be useful.
But whether they should be treated as KPIs depends on the goal they are meant to measure.
The strongest SEO reporting separates:
business outcomes
from:
supporting indicators and activity metrics.
What is a KPI?
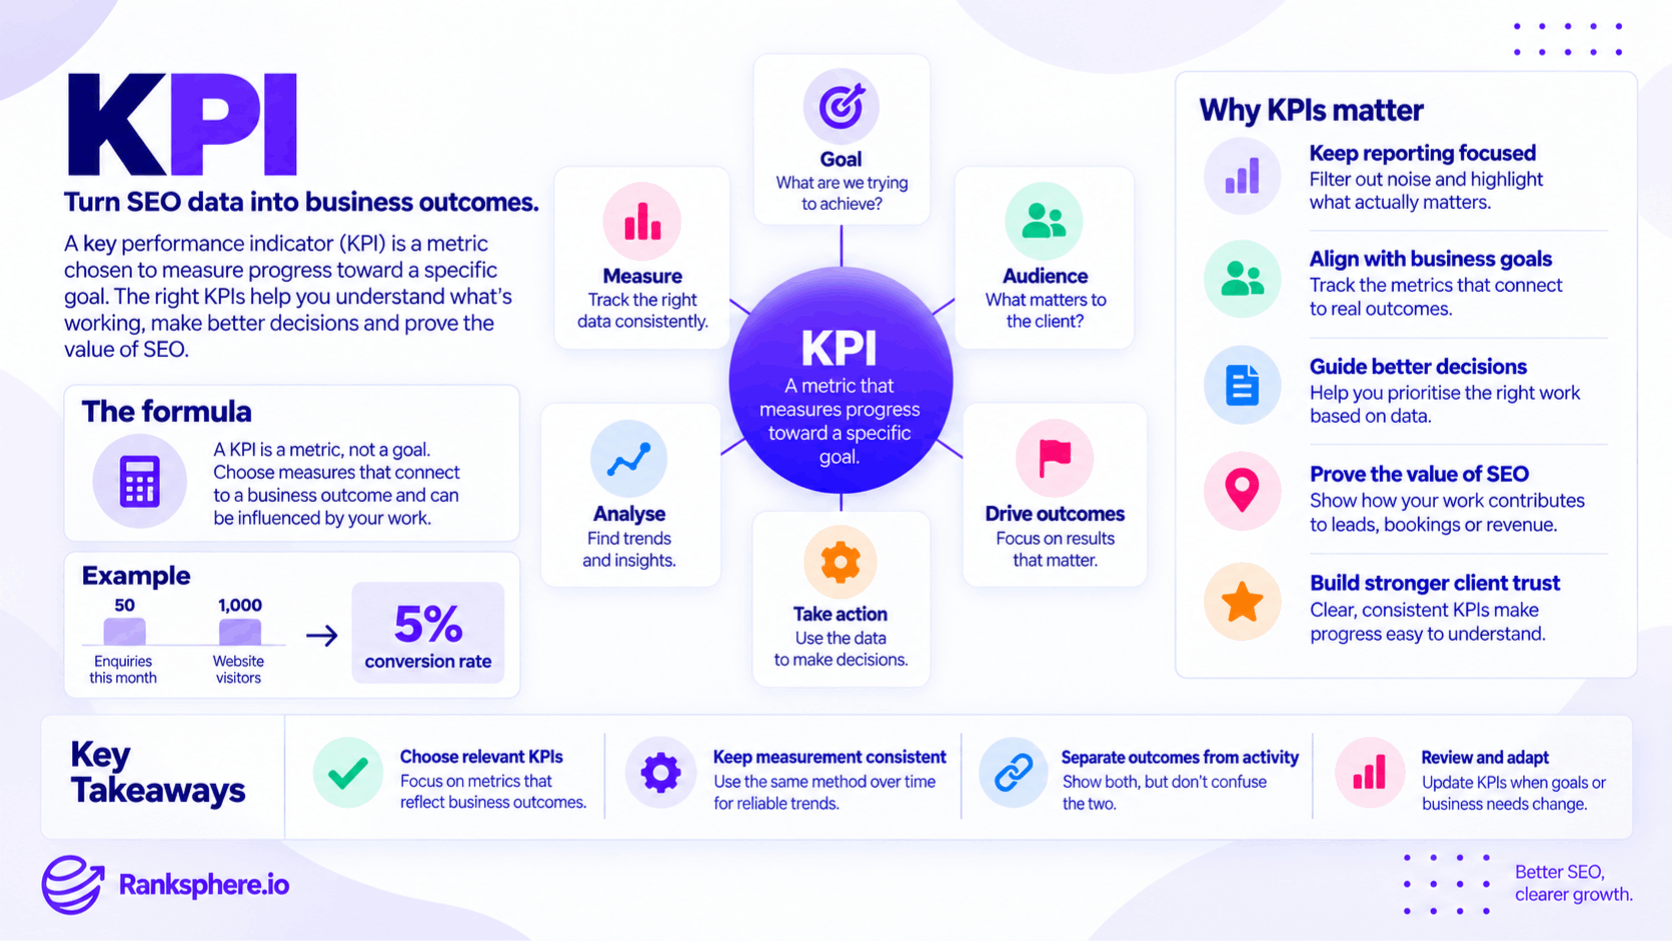
A KPI is a metric chosen because it represents meaningful progress towards an agreed objective.
For example:
Goal
Increase new-patient appointments from organic and local search.
Possible KPIs
- Qualified enquiries
- Appointment bookings
- Calls from Google
- Organic conversions
Supporting metrics
- Local pack visibility
- Organic clicks
- Review growth
- Search impressions
Activity metrics
- Pages updated
- Citations corrected
- Technical issues fixed
All three categories can be useful.
The mistake is presenting activity as though it were the business outcome.
KPI vs metric
Every KPI is a metric.
Not every metric is a KPI.
For example:
is a metric.
It may become an important KPI during a performance-improvement project.
But for a local dentist whose primary objective is increasing implant consultations, page speed probably should not be the headline number in the monthly client report.
Likewise:
is a metric created by a third-party SEO provider.
It can be useful for certain comparisons.
That does not make it a meaningful business KPI.
The right KPI depends on what you are trying to achieve.
What makes a good KPI?
A useful KPI usually has several qualities.
It relates to an important goal
The metric should connect to something the business genuinely wants.
For example:
- Leads
- Calls
- Bookings
- Revenue
- Local visibility
If nobody would make a decision differently because the number changed, it probably does not belong at the top of the report.
It can be measured consistently
The measurement method should remain reasonably stable over time.
If local rankings are checked from:
one postcode this month
and:
a completely different location next month
the comparison becomes weak.
The same principle applies to:
- Conversion tracking
- Call tracking
- Geo-grid settings
- Review reporting
Consistency makes trends more meaningful.
It is understandable
A useful KPI should not require several paragraphs of explanation every month.
For example:
37 qualified enquiries
is easy to understand.
Local search visibility score 73.4
requires explanation unless the client already knows exactly what the score represents.
That does not make proprietary scores useless.
It means they should not replace clearer business measures without good reason.
It can influence decisions
A KPI should help determine what happens next.
If top-three local coverage drops in the western part of a service area, the team can investigate.
If organic clicks rise but enquiries remain flat, the issue may be:
- Search intent
- Landing-page quality
- Conversion tracking
- Lead quality
Good KPIs do more than decorate reports.
They help guide action.
KPIs should match the business objective
There is no universal SEO KPI set.
A plumber, dental practice and multi-location retailer may need completely different headline measures.
For a plumber, the priority may be:
qualified calls
For a dentist:
appointment enquiries
For a retailer:
store visits, direction requests or revenue
For a multi-location brand:
local visibility across locations
The reporting structure should start with the business objective rather than with whichever metrics the SEO platform happens to provide.
Local SEO KPIs
Local SEO needs a different reporting approach from purely national organic SEO because much of the customer journey can happen directly within Google.
Someone may:
- Search for a local business.
- See the local pack.
- Read reviews.
- Call the business.
The website may never be visited.
That means local reporting often needs to combine website data with Google Business Profile and local visibility data.
Qualified enquiries
Where they can be measured reliably, enquiries are one of the strongest local SEO KPIs.
Examples include:
- Phone calls
- Contact forms
- Appointment requests
- Quote requests
- Bookings
The word qualified matters.
Ten enquiries for services the company does not provide are not necessarily better than five strong leads.
Where possible, distinguish:
total enquiries
from:
qualified enquiries.
Bookings and sales
For businesses where the customer journey can be tracked through to a booking or purchase, this may be even more useful.
Examples include:
- Dental appointments
- Restaurant reservations
- Ecommerce purchases
- Consultation bookings
These metrics sit closer to the commercial result than rankings or impressions.
However, attribution may not always be perfect.
A customer may discover the company through Search and book days later through another channel.
Be clear about what the tracking can and cannot prove.
Google Business Profile interactions
Google Business Profile data can provide important local-search indicators.
Depending on the business and what Google reports, useful measures can include:
- Calls
- Website clicks
- Direction requests
- Booking interactions
These can be valuable because they show actions taken directly from Google's local ecosystem.
But not every interaction is a confirmed customer conversion.
For example:
A direction request does not prove the person visited.
A phone-call click does not prove the call became a customer.
Use the metrics as meaningful indicators without overstating what they represent.
Geo-grid coverage
Geo-grid tracking measures local rankings from multiple locations across a target area.
One useful KPI is:
top-three grid coverage
which measures how many tracked points show the business within the top three local results.
For example:
21 of 49 grid points in the top three
equals roughly:
43% top-three coverage.
This can be much more informative than one local ranking checked from a single point.
Ranksphere's rank tracker reports coverage and share of voice across your service area, making geographic local visibility easier to track consistently over time.
Is top-three coverage the best local SEO KPI?
Not always.
It can be an excellent visibility KPI.
But visibility is not necessarily the client's final goal.
Suppose top-three coverage improves substantially while:
- Calls remain flat
- Bookings decline
- Revenue does not change
The coverage improvement is still useful information.
But it should not automatically be presented as proof that the campaign has achieved its business objective.
The best reporting connects:
visibility → engagement → conversion → commercial outcome
where the available data allows it.
Share of local voice
Share of local voice can provide useful competitive context.
Instead of asking only:
Where do we rank?
it asks something closer to:
How much visibility do we have compared with the businesses competing for the same local searches?
This can be useful for:
- Competitive analysis
- Multi-location reporting
- Tracking market visibility
Like any third-party metric, its meaning depends on the methodology used.
Keep that method consistent when comparing periods.
Organic clicks
Organic clicks from Search Console can be useful for understanding how often search visibility turns into website visits.
Track them separately from:
- Local pack interactions
- Google Business Profile activity
because these are different search experiences.
A local business may see:
website clicks fall
while:
profile calls increase.
Looking at only one source could give the wrong impression.
Organic impressions
Impressions can also be useful.
They may indicate:
- Increased search visibility
- New query coverage
- Demand changes
- Expanded geographic visibility
But impressions are usually stronger as a supporting metric than as a standalone business KPI.
For example:
Impressions increased 40%.
That sounds positive.
But if clicks and enquiries both declined, the business has not necessarily benefited from that growth.
Provide context.
Click-through rate
Click-through rate can help explain whether impressions are becoming clicks.
CTR can be influenced by:
- Ranking position
- Search intent
- Title presentation
- SERP features
- Brand recognition
It can be useful diagnostically.
But it should not automatically be treated as a headline KPI for every business.
A lower CTR does not necessarily mean poorer performance if visibility expanded into a larger set of lower-ranking queries.
Interpret it alongside the other metrics.
Conversion rate
Conversion rate measures the proportion of users who complete a desired action.
For example:
50 enquiries from 1,000 landing-page visits = 5% conversion rate
This can be an important KPI for:
- Service pages
- Landing pages
- Ecommerce pages
It helps separate:
getting traffic
from:
turning traffic into business.
A page receiving more visitors is not necessarily improving if fewer of them take the desired action.
Review metrics
Reviews are important for local businesses because they influence customer decision-making and contribute to Google's broader understanding of local prominence.
Useful review metrics can include:
- Total review count
- Average rating
- New reviews gained
- Response rate
- Review velocity
But be careful with interpretation.
Google does not publish a rule saying:
higher review velocity = higher rankings.
Review growth can be a useful reputation and local SEO indicator without being treated as a confirmed standalone ranking formula.
Domain Authority
Domain Authority is a third-party metric developed by Moz.
It is not:
- A Google metric
- A Google ranking factor
- A direct measure of local SEO success
It may be useful when comparing websites or evaluating broad backlink strength.
But:
DA increased from 19 to 25
does not prove that:
- Local visibility improved
- Leads increased
- Revenue grew
For most local clients, it should be supporting analysis rather than a headline KPI.
Keyword counts
Metrics such as:
Ranking for 450 keywords
need context.
A site can gain hundreds of low-value queries that produce:
- Few clicks
- No enquiries
- No commercial value
while losing visibility for one highly valuable service term.
Keyword-count growth can be useful for understanding search breadth.
It should not automatically be treated as success.
Single-point rankings
A local ranking checked from one location can be useful when that location matters.
For example:
How visible are we from the town centre?
A single-point check can answer that question.
The problem comes when that ranking is presented as:
the business's overall local position.
Proximity can change results significantly.
A grid usually provides a more representative picture of geographic coverage.
Average position
Average position can also be useful when interpreted correctly.
But averages compress variation.
Suppose a business ranks:
- Position 2 close to its premises
- Position 7 two miles away
- Position 15 farther across town
One average number cannot show that geographic pattern.
Use averages for trend context.
Use geo-grid data when local coverage matters.
Website sessions
Website sessions remain useful.
They can show:
- Traffic trends
- Landing-page performance
- Channel growth
But for local businesses, sessions rarely tell the whole story because customers may interact with the company through:
- Calls
- Maps
- Directions
- Google Business Profile
without visiting the website.
That makes sessions a useful metric, but not necessarily the main local SEO KPI.
Activity metrics
Activity metrics explain what work was completed.
Examples include:
- Pages published
- Citations corrected
- Technical issues fixed
- Internal links added
These are useful for accountability.
But:
14 citations built
does not prove performance improved.
Separate:
what the team did
from:
what happened afterwards.
Leading vs lagging indicators
The distinction between leading and lagging indicators can help when results take time.
Leading indicators
These suggest whether progress is moving in the right direction before the final outcome is fully visible.
Depending on the campaign, examples might include:
- Increasing relevant search visibility
- Growing qualified organic traffic
- Review acquisition
- Improved conversion rate
- Increased coverage of important queries
These are not guarantees of later revenue.
They are earlier signs that parts of the strategy may be working.
Lagging indicators
These reflect outcomes that usually appear later in the process.
Examples include:
- Qualified leads
- Bookings
- Sales
- Revenue
- Customer acquisition
The distinction is not absolute.
For one business, calls may happen quickly.
For another, a sale may take months.
The customer journey determines what is leading and what is lagging.
Outputs are not necessarily leading KPIs
It is tempting to call:
- Pages published
- Citations corrected
- Profile fields completed
leading KPIs.
Usually, these are better described as outputs or activities.
They show that the work happened.
They do not necessarily predict the result.
For example:
Four service pages published
is not automatically evidence that visibility will improve.
The pages still need to be:
- Useful
- Relevant
- Crawlable
- Indexed
- Competitive
Keep activity reporting separate from performance measurement.
Supporting metrics are still useful
A metric does not have to be a headline KPI to deserve attention.
For example:
Index coverage
may not be what the client ultimately cares about.
But if important pages disappear from Google's index, it becomes highly relevant.
The reporting hierarchy might therefore look like:
Primary KPI
Qualified enquiries
Secondary KPI
Local visibility
Diagnostic metrics
Clicks, CTR, indexing, rankings
Activity metrics
Pages updated, citations corrected
That creates a much clearer reporting structure.
How many KPIs should you use?
There is no universal correct number.
For many small local businesses, a short set may be easier to understand.
Perhaps:
- 3 primary KPIs
- Several supporting metrics
A large multi-location business may need more.
The aim is not to force every campaign into:
exactly five KPIs.
It is to keep the key measures focused enough that people actually understand what they mean.
Choose KPIs during onboarding
KPIs should ideally be agreed during client onboarding.
Ask:
- What does the client actually want?
- Which actions have commercial value?
- What can we measure reliably?
- What attribution limitations exist?
- What would success look like?
This prevents the monthly report from becoming a debate about which number matters.
Do not change KPIs because performance looks bad
If the agreed KPI declines, report the decline.
Do not suddenly replace:
qualified enquiries
with:
website impressions
because the second number looks better.
Metrics may need to change legitimately when:
- Business objectives change
- Tracking improves
- Services change
- New locations open
When they do, document the change and explain why.
Keep measurement consistent
Trend reporting only works when measurement is comparable.
For example, do not change:
- Grid size
- Search locations
- Keyword set
- Conversion definitions
every month without documenting it.
If methodology changes, consider establishing a new baseline.
Otherwise, the apparent improvement may come from the measurement change rather than from actual performance.
KPIs for different local businesses
Different businesses need different measures.
Dentist
Possible KPIs:
- New-patient enquiries
- Treatment bookings
- Local visibility for priority services
Emergency plumber
Possible KPIs:
- Qualified calls
- Emergency-service enquiries
- Local pack coverage
Multi-location retailer
Possible KPIs:
- Location-level local visibility
- Direction requests
- Store-level conversions
There is no reason they should all receive the same dashboard.
KPIs and seasonality
A KPI can move for reasons unrelated to SEO.
For example, heating-service calls may naturally rise in winter.
Garden-service enquiries may rise in spring.
That means a month-on-month increase does not automatically prove SEO improved.
Where appropriate, compare:
- Month over month
- Year over year
- Campaign baseline
and explain seasonal context.
KPIs and attribution
SEO attribution is rarely perfect.
A customer may:
- Discover the business through local search.
- Read reviews.
- Visit the website later.
- Call directly.
Which channel gets the conversion?
Analytics may not capture the full journey.
Report attribution as accurately as possible, but avoid pretending the tracking knows more than it does.
KPI vs SEO ROI
KPIs should ultimately help explain SEO ROI.
But not every KPI is financial.
For example:
top-three local coverage
can tell you whether visibility improved.
qualified leads
can show commercial response.
revenue
moves closer to financial return.
The useful reporting chain is:
Visibility → engagement → conversion → revenue
where each stage can actually be measured.
Common KPI mistakes
- Treating every metric as a KPI.
- Choosing numbers because they are easy for the agency to improve.
- Making top-three grid coverage the universal headline KPI.
- Treating review velocity as a confirmed direct ranking factor.
- Using Domain Authority as proof of SEO success.
- Reporting raw keyword counts without considering relevance.
- Treating impressions as business growth on their own.
- Using website sessions as the whole local SEO story.
- Calling activity metrics business outcomes.
- Presenting single-point rankings as market-wide visibility.
- Changing KPIs whenever performance declines.
- Changing measurement methodology without explaining it.
- Using the same KPIs for every client.
- Ignoring seasonality and attribution limitations.
- Reporting so many KPIs that none of them feels important.
KPI best practices
- Start with the business objective.
- Choose KPIs that help show progress towards that objective.
- Separate primary KPIs from supporting and diagnostic metrics.
- Use qualified leads, bookings or revenue where they can be measured reliably.
- Use geo-grid coverage when geographic local visibility matters.
- Track Google Business Profile interactions alongside website performance.
- Keep organic and local pack visibility separate.
- Use activity metrics to show work completed, not to prove results.
- Keep the measurement method stable.
- Agree definitions during onboarding.
- Report declines as clearly as improvements.
- Review KPIs when the business objective changes, not simply when a number becomes uncomfortable.
Example
“An agency reports six headline KPIs to Marchfield Plumbing:
- Number of keywords tracked
- Keywords in the top ten
- Domain Authority
- Search impressions
- Pages published
- Citations built
Every number increases over several months.
The report looks successful.
But there is a problem.
The client is not receiving more qualified enquiries.
Several of the supposed KPIs are actually different types of metrics.
Pages published and citations built are outputs.
Domain Authority is a third-party metric.
Keyword count depends heavily on which queries are being tracked.
Impressions show visibility but not whether that visibility becomes business.
The reporting structure is changed.
The new headline measures focus on:
- Qualified enquiries
- Google Business Profile calls
- Top-three geo-grid coverage
- Review performance
Supporting data still includes:
- Organic clicks
- Rankings
- Impressions
- Technical progress
but those numbers no longer compete with the actual business outcomes for attention.
Over time, the agency can see whether broader local visibility is accompanied by more:
- Calls
- Leads
- Customers
without claiming that one metric automatically caused another.
That is what a KPI is for.
It is not the number that looks best in the report. It is the number that helps the business understand whether it is moving towards the outcome that actually matters.”
See also
- White-label reporting — where KPIs are presented and explained
- Share of local voice — competitive local-search visibility
- Geo-grid rank tracking — measuring rankings across multiple locations
- Conversion rate — measuring how often visitors complete a desired action
- Domain authority — a third-party metric rather than a Google KPI
- SEO ROI — connecting SEO performance with financial return